
Figure 5.
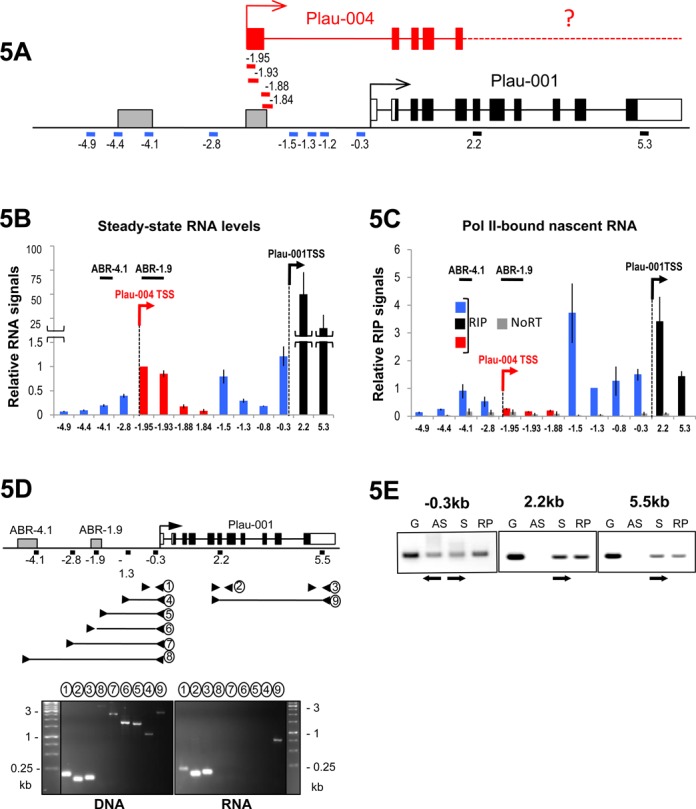
Pol II tracking at the Plau locus in MDA-MB231 cells. (A) Structure of the Plau locus. Black lines indicate RT-qPCR amplicons corresponding to coding sequences included in the Plau-001 mRNA. Blue lines indicate RT-qPCR amplicons corresponding to either intervening sequences not included in spliced Plau-004 mRNA or sequences lying upstream of ABR-1.9. Red lines indicate RT-qPCR amplicons whose 5′ end are located within Plau-004 exon 1 and whose 3′ ends are located within either Plau-004 exon 1 (−1.95 and −1.93 kb; i.e. amplicons included in Plau-004 mRNA) or at the beginning of Plau-004 first intervening sequence (−1.88 and −1.84 kb; i.e. amplicons not included in the spliced Plau-004 mRNA). Amplicons were all of small sizes (60–100 nt). (B) Steady-state levels of RNA transcripts upstream of Plau-001 TSS. RT-qPCRs were carried out as in Figure 4C using total RNA from MDA-MB231 cells. The color code is the same as in (A). (C) Assay of RNA Pol II-associated RNA (RIP). RNA bound to immunoprecipitated Pol II were purified as described in Materials and Methods. After reverse transcription using random primers, RT-qPCRs were conducted using the amplicons depicted in A to assess the relative abundances of nascent RNAs at different positions on the uPA locus. The color code is the same as in A and B. (D) Short RNA transcripts between ABR-1.9 and Plau-001 TSS. DNA and total RNA were prepared from MDA-MB231 cells, which was followed by reverse transcription of RNA using random primers. Amplicons of different sizes and positions were amplified by PCR as depicted in the upper panel of the figure and then analyzed by electrophoresis through agarose gels. Amplification products obtained with genomic DNA are presented in the left lower panel and permitted to validate the use of the selected amplification oligonucleotides. RT-PCR products are presented in the right lower panel. Fragments 2, 3 and 9 correspond to Plau-001 mRNA. Only fragment 1 (163 bp) could be amplified between Plau-001 and ABR-1.9. (E) Bidirectional transcription upstream of Plau-001 TSS. Total RNA from MDA-MB231 cells was prepared. Reverse transcriptions were carried out under three conditions: (i) random primers as a positive control not discriminating sense or antisense transcription, (ii) sense primers to visualize antisense transcription and (iii) antisense primers to visualize sense transcription. Oriented reverse transcriptions were initiated at positions −0.3 (upstream of Plau-001 TSS), +2.2 (within Plau-001 exon 6) or +5.5 kb (within Plau-001 3′ UTR). PCRs (30 cycles) were then performed using the same above-described sense and antisense primers plus appropriate primers allowing to generate 160, 193 and 110 bp amplicons, respectively, which were subsequently analyzed by agarose gel electrophoresis. Genomic DNA (G) was used as a positive control of amplification. S and AS refer to sense and antisense transcription, respectively, whereas RP refers to reverse transcription with random primers not discriminating sense and antisense transcription. Antisense transcription was found only upstream of Plau-001 TSS.