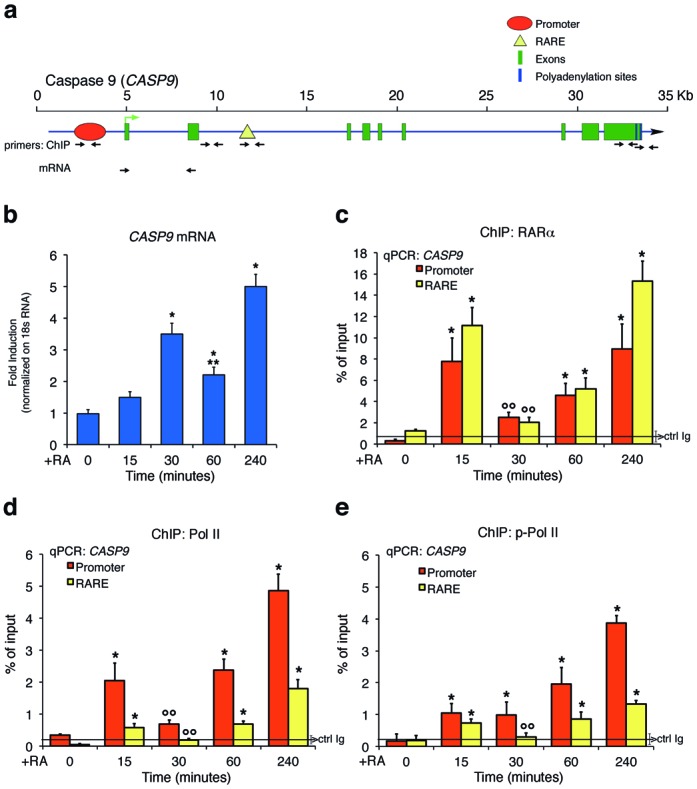
Figure 1.

Retinoic acid (RA) induction of CASP9 mRNA and recruitment of retinoic acid receptor alpha (RARα) and phosphorylated RNA polymerase II to retinoic responsive element (RARE) and promoter of CASP9 gene. (a) Structure of CASP9 gene. The TSS and the direction of transcription are indicated by a green arrow; the exons, promoter, polyA addition sites and RARE are shown by different colors indicated at the upper right corner. The black arrows indicate the primers used for ChIP and mRNA analysis. (b) Total RNA was prepared from MCF-7 hormone-starved or stimulated with 300-nM RA for 15, 30, 60 and 240 min and analyzed by qPCR with specific primers (panel (a)) to CASP9 mRNA normalized to 18S RNA levels. The statistical analysis derived from at least three experiments in triplicate (n ≥9; mean ± SD); *P < 0.01 (matched pairs t-test) compared to RA-unstimulated sample, **P < 0.01 (matched pairs t-test) comparing 30–60 min of RA exposure. (c, d, e) qChip analysis of RA-dependent occupancy of RARα, RNA polymerase II (Pol II) and phosphorylated RNA polymerase II (p-Pol II) at the promoter and RARE. MCF7 cells were stimulated with 300-nM RA for 15, 30, 60 and 240 min. The chromatin was immunoprecipitated with antibodies directed against RARα, Pol II, p-Pol II. Panel (c) shows the recruitment of RARα to the promoter and RARE sequences of CASP9 gene. Panels (d) and (e) show the recruitment of Pol II (d) and p-Pol II (e) at the promoter and RARE. The black, horizontal line (brackets ± SD) in each plot indicates the percent of input from a control ChIP (Ab: non-immune serum). The statistical analysis derives from at least three experiments in triplicate (n ≥ 9; mean ± SD); *P < 0.01 (matched pairs t-test) compared to RA-unstimulated sample; °°P < 0.01 (matched pairs t-test) compared 15–30-min stimulated samples.
