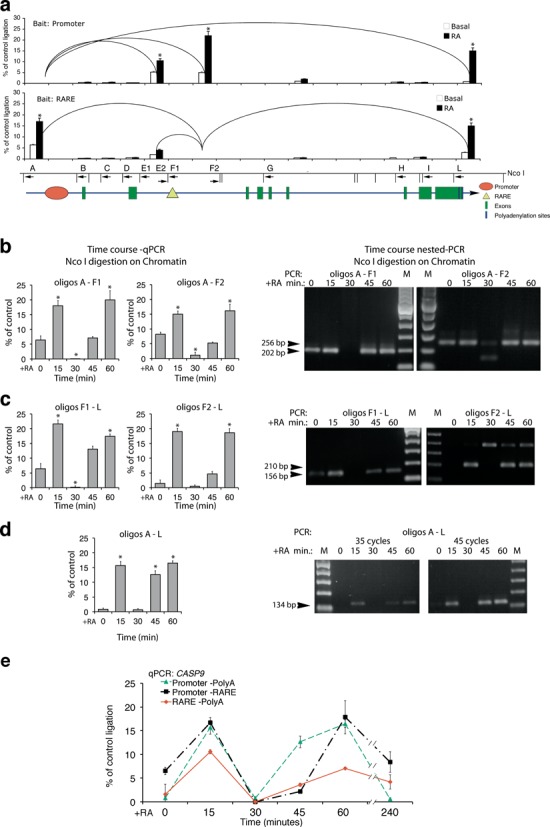
Figure 6.

Formation of dynamic chromatin loops during early RA-induced transcription. 3C analysis of CASP9 chromatin in MCF7 cells exposed to 300 nM of RA for various periods of time. (a) The histograms show the frequency of ligation of the CASP9 NcoI fragments amplified with primers indicated below the NcoI restriction map. All the combinations of primers indicated were performed on ligated chromatin; the histogram shows qPCR amplifications above 1%, relative to the control. Each loop was detected with different primers pairs and the two histograms show the analysis by using several probes and ‘baits’ centered at the TSS, RARE and 3′ end of the CASP9. Differences between recombinant, Basal and RA-treated cells derived-chromatin were tested for statistical significance using Student's t-test: *P < 0.01 as compared to untreated control. (b, c, d) Time course of chromatin looping following RA induction. 3C analysis was carried out as described in the Materials and Methods section and the loops shown in panels (b, c, d) were quantified by qPCR (left panels) and verified by gel electrophoresis (right panels) and DNA sequencing (data not shown). The results shown derive from at least three experiments in triplicate (n ≥ 9; mean ± SD). *P < 0.01 as compared to untreated samples. (e) The panel shows the time course of loop formation. Data were collected from real-time qPCR and from semi-quantitative, nested PCR, experiments. The extra band seen in panel (c) is a skipped restriction site that adds 187 bp to the expected fragment (210 bp). This band is specific because the same loop (RARE-polyA) analyzed with another primer (F1) does not produce extra bands. Also, following the treatment with RA, this longer fragment accumulates while the shorter one (cleaved by the enzyme in the chromatin) almost disappears. This indicates that this site is protected in vivo and is not cleaved efficiently by NcoI restriction enzyme.
