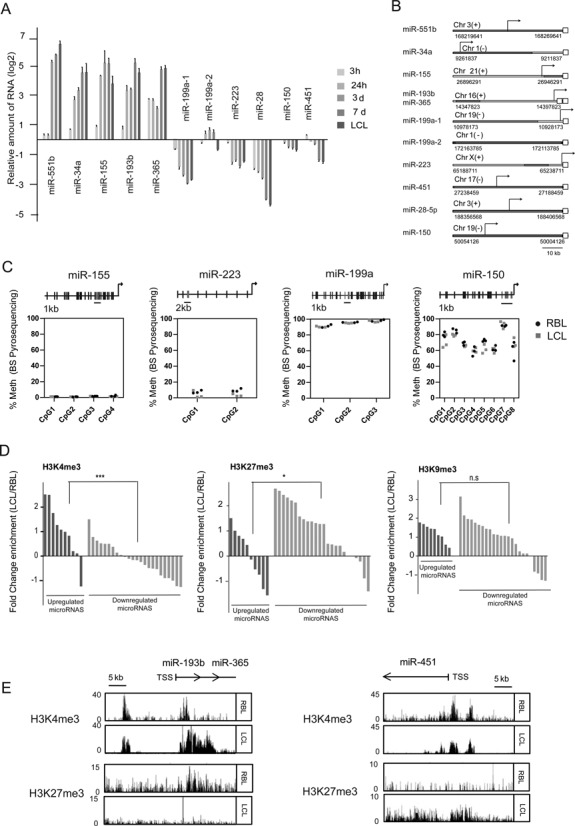
Figure 2.

Transcriptional and epigenetic control of miRNAs in EBV-mediated transformation of RBLs. (A) qRT-PCR analysis of miRNA precursors (primary miRNAs) for the top five upregulated and downregulated miRNAs at different times (3 h, 1, 3, 7 days and LCLs) following infection of RBLs with EBV (2089 EBV strain). (B) Scheme depicting the genomic localization of selected miRNAs. Each empty square represents the mature form of a given miRNA. TSSs are indicated with an arrow. TSS locations were predicted using miRStart (http://mirstart.mbc.nctu.edu.tw/) (25). (C) Analysis of DNA methylation changes in CpGs by pyrosequencing. For each miRNA 2–8 consecutive CpGs were analyzed in RBLs and LCLs. The location of the analyzed CpGs is represented on top in relation with the TSS (indicated by an arrow). (D) Comparison of the ChIP-seq profiles for H3K4me3, H3K27me3 and H3K9me3 between RBLs and LCLs for all miRNAs of our study. A window of 5000 bp was inspected. The values correspond to the ratio between LCL and RBL of the average value using 50 bp segments within the 5000 bp window of each miRNA. Log2 values are represented. (E) Examples of the comparison of the ChIP-Seq profiles of two histone modifications (H3K4me3, active transcription; H3K27me3, repression) for one upregulated miRNA (miR-193b/miR-365) and one downregulated miRNA (miR-451) in RBLs and LCLs.
