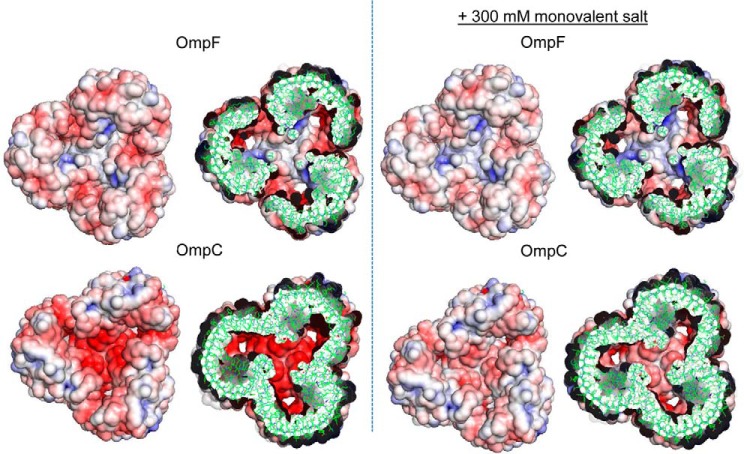
FIGURE 10.
Electrostatic property of OmpF and OmpC. Analysis was done at the condition that roughly corresponds to 50 mm potassium/phosphate (pH 7.0) containing 5 mm MgCl2 (left panel) or with additional 300 mm monovalent salt (right panel). All images are the views from outside (extracellular side). The section images show the slab of ±15 Å from Arg-82 of OmpF and Arg-72 of OmpC. Electrostatic potential was visualized with blue (positive potential) to red (negative potential) color corresponding to potential of ± 7 kT/e.

