FIGURE 3.

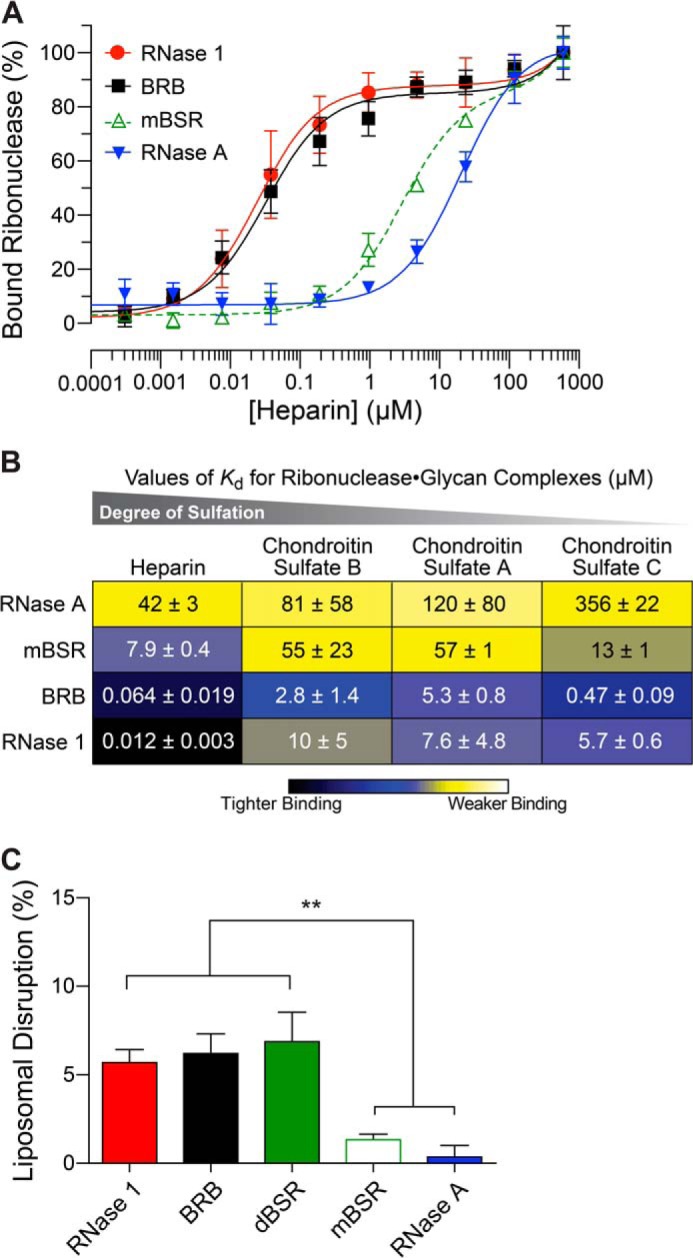
Interaction of human and bovine ribonucleases with membranes. A, representative isotherms for binding of BODIPY-labeled ribonucleases to heparin as determined by fluorescence polarization. B, heat map indicating the relative affinity for various cell surface glycans, determined as in panel A. Values (mean ± S.E.) are from at least three independent experiments. Blue tones represent nm affinity; yellow tones represent μm affinity. C, disruption of phosphatidylcholine liposomes by ribonucleases, as measured by the release of an encapsulated dye. Values (mean ± S.E.) are from at least three independent experiments. **, p < 0.01.
