
FIGURE 3.
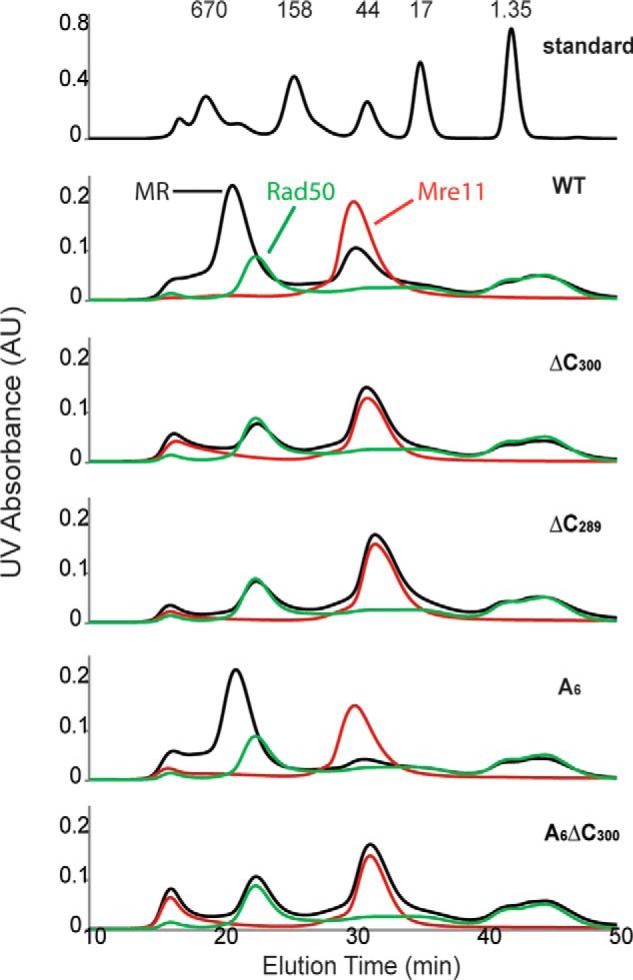
Gel filtration analysis of WT and mutant Mre11 (red), Rad50 (green), and MR (black) complex. For each run, 100 μl of sample with Mre11, Rad50, or MR complex was injected. The protein concentrations are 100 μm for Mre11 and 50 μm for Rad50. The WT·MR and A6·MR complex peaks shift to earlier elution times relative to Rad50 alone, indicating the formation of MR complex, whereas none of the C-terminal deletions of Mre11 interact with Rad50. AU, absorbance units.