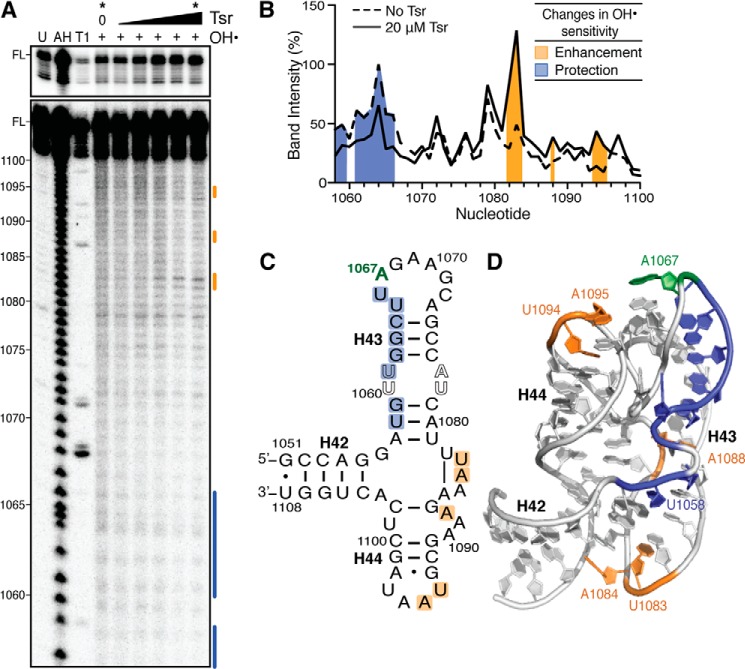
FIGURE 3.
Hydroxyl radical probing identifies the Tsr footprint and cleavage enhancements upon Tsr binding. A, representative hydroxyl radical probing gel of wild-type 58-nt RNA complexed with an increasing concentration of Tsr (left to right: 0.2, 1, 5, 10, and 20 μm). Untreated RNA (U), partial alkaline hydrolysis nucleotide ladder (AH), and RNase T1 digestion under denaturing conditions (T1) allow nucleotide identification (marked on left); FL is the full-length 58-nt RNA band, also shown with lighter exposure in the top panel. B, quantification of each band in the lanes without Tsr and with Tsr at 20 μm (noted * at top). Cleavage protections and enhancements are shown as blue and orange shading, respectively. Changes in sensitivity to hydroxyl radicals are mapped as protections (blue) and enhancements (orange) onto C, the 58-nt RNA secondary structure, and D, the x-ray crystal structure (PDB ID 1HC8).

