
FIGURE 5.
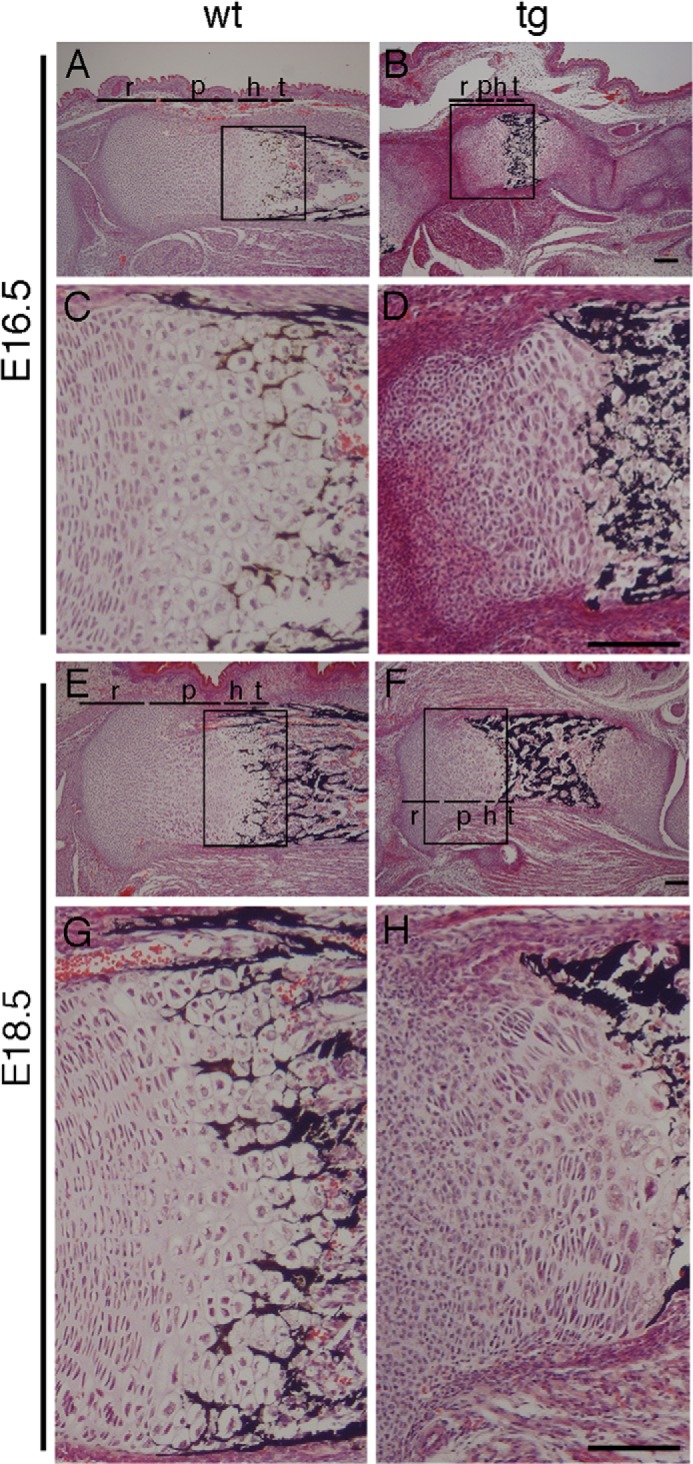
Histological analysis of growth plates. H&E and von Kossa staining of tibia sections at E16.5 (A–D) and E18.5 (E–H) from wild-type (A, C, E, and G) and Galnt3 transgenic mice (B, D, F, and H). Boxed regions in A, B, E, and F are magnified in C, D, G, and H, respectively. The layers of resting (r), proliferating (p), hypertrophic (h), and terminal hypertrophic (t) chondrocytes are shown in A, B, E, and F. Scale bars, 100 μm.