
FIGURE 7.
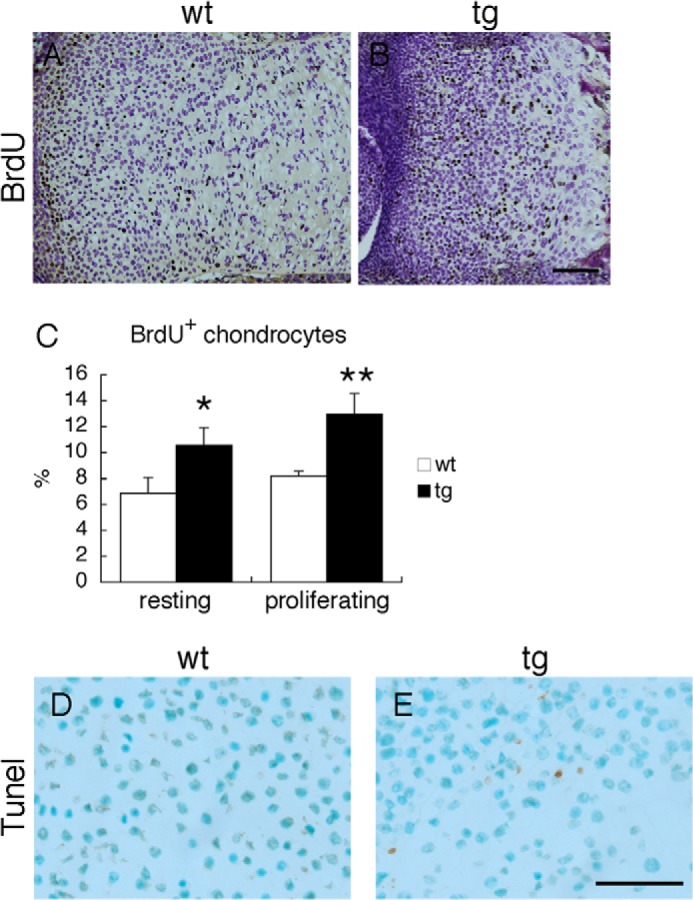
BrdU labeling and TUNEL staining. A and B, immunolocalization of incorporated BrdU on tibia slices from wild-type (A) and Galnt3 transgenic (B) embryos at E18.5. Scale bar, 100 μm. C, the percentage of BrdU-positive cells in wild-type (wt) and Galnt3 transgenic (tg) mice. The percentage was analyzed in the resting and proliferating layers. The cells in a minimum of three sections per embryo were counted, and three wild-type and three Galnt3 transgenic embryos were examined. *, p < 0.05; **, p < 0.001. D and E, TUNEL staining of resting chondrocyte layers from wild-type (D) and Galnt3 transgenic (E) embryos at E18.5. Scale bar, 50 μm. Error bars, S.D.