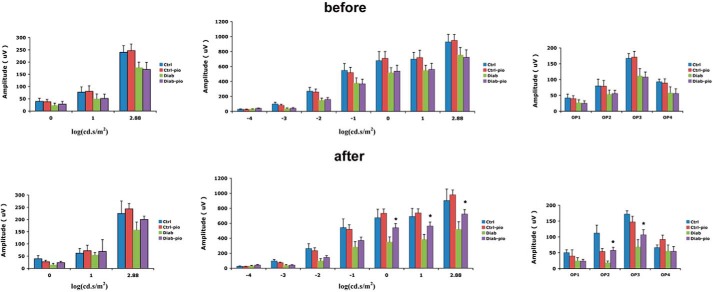
FIGURE 2.
B-wave amplitudes are improved in diabetic rats treated with pioglitazone. Top, ERG amplitudes for A-wave (left), B-wave (middle), and oscillatory potentials (right) before treatment was started. Bottom, effects of 2 months of pioglitazone treatment. *, p < 0.05 versus diabetic. Data are mean ± S.D. (error bars); n = 5 in all groups.

