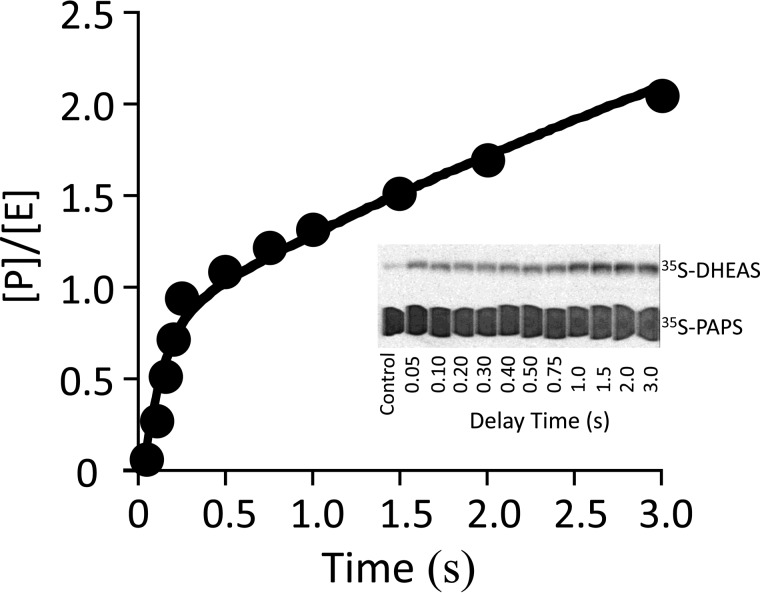
FIGURE 2.
A burst of product. Reactions were initiated by rapidly mixing (1:1 v/v) a solution containing SULT2A1 (24 μm, dimer) with [35S]PAPS (40 μm, 4.1 Ci/μmol, 133 × Kd [E]). The solution was then mixed with an equal volume of DHEA (50 μm, 46 × Kd [E·PAPS]); all solutions contained MgCl2 (5.0 mm), NaPO4 (50 mm), pH 7.2, and were equilibrated at 25 ± 2 °C prior to mixing. Reactions were quenched with NaOH (0.20 m, final), neutralized, boiled, and centrifuged to remove the protein. [35S]DHEAS was separated from [35S]PAPS by reverse-phase TLC (see inset), and radiolabeled reactants were quantitated by two-dimensional imaging using a STORM system (Nikon Instruments). Each point is the average of two independent determinations. The solid line through the data is not a statistical fit; rather, it is the behavior predicted using the rate constants in Table 1 and the model in Fig. 5. [P]/[E] is the concentration of product divided by the concentration of enzyme.

