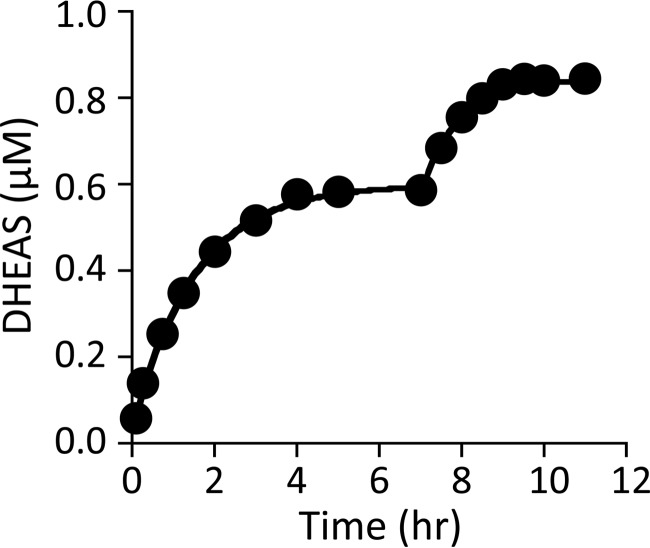
FIGURE 3.
Progress curves and simulations of DHEAS formation. The initial reaction conditions were as follows: DHEA (1.1 μm, 1.0 × Kd [E]), DHEAS (0.50 mm, 1.0 × Kd [E]), [35S]PAPS (1.0 μm, 3.7 × Kd [E]), PAP (10 μm, 27 × Kd [E]), MgCl2 (5.0 mm), and NaPO4 (50 mm), pH 7.2, T = 25 ± 2 °C. The reaction was allowed to reach what appeared to be equilibrium (7.5 h), at which point the DHEA concentration was increased to 0.50 μm and the reaction was again allowed to plateau. The rate constant for conversion of the product to the substrate central complex was obtained by fitting the data using the 21 other constants (Table 1) associated with the mechanism (Fig. 5). Both phases yielded the same rate constant, 6 (± 0.8) × 10−3 s−1, and overall equilibrium constant, 3.8 (± 0.7) × 104.

