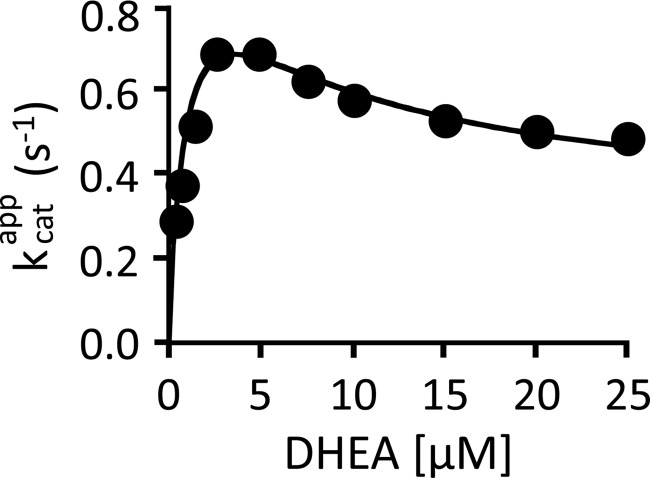
FIGURE 5.
Partial substrate inhibition by DHEA. The initial rate of product formation was determined as a function of DHEA concentration. The reaction conditions were as follows: SULT2A1 (0.50 nm), [3H]DHEA (0.30–25 μm), PAPS (30 μm, 100 × Kd [E·DHEA]), MgCl2 (5.0 mm), and NaPO4 (50 mm), pH 7.2, T = 25 ± 2 °C. Reactions were initiated by the addition of enzyme. Reactions were quenched with (0.20 m, final). [3H]DHEA was extracted with chloroform, and [3H]DHEAS in the aqueous phase was quantified. Data are plotted as kcatapp versus [DHEA], where kcatapp = initial rate/[enzyme active sites]. Each point is the average of two independent determinations. The solid line through the data does not represent a fit of the data; rather, it is the behavior predicted using the 22 constants listed in Table 1 and the model shown in Fig. 5.

