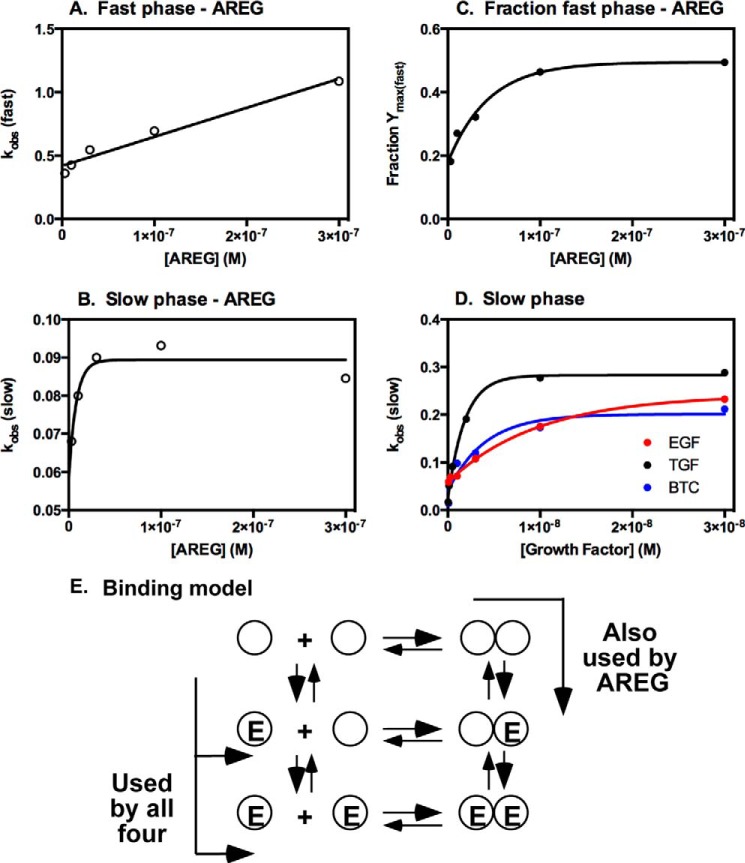
FIGURE 7.
Secondary plots from luciferase complementation in cells expressing ΔC-EGFR-NLuc and ΔC-EGFR-CLuc. The curves for luciferase complementation for the four ligands shown in Fig. 7 were fit to either single (EGF, TGFα, and BTC) or double (AREG) exponential models (see text). The resulting kobs was plotted against the concentration of growth factor. A, kobs for the fast phase of the AREG curves plotted against [AREG]. B, kobs for the slow phase of the AREG curves plotted against [AREG]. C, fraction of the total signal attributable to the fast phase plotted against [AREG]. D, kobs for the curves for EGF, TGFα, and BTC plotted against the concentration of that growth factor. E, model for dimerization of the EGF receptor.

