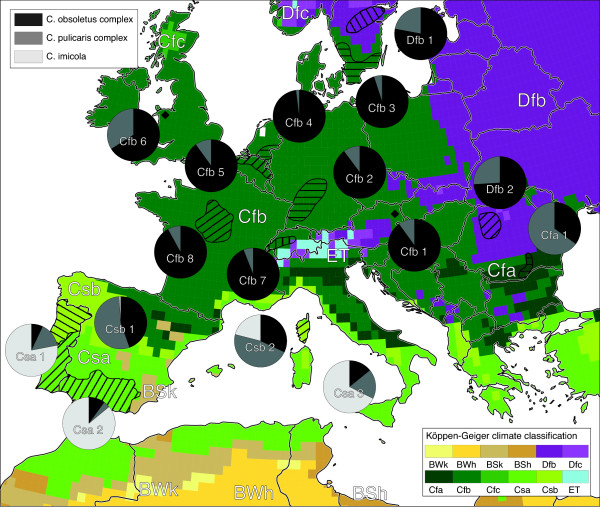
Figure 1.

Spatial distribution of observed Culicoides spp. compositions underlaid with a map of the Köppen-Geiger climate classification. Monitoring regions were marked by shaded areas and squares for which pie charts were compiled. Pie chart labels refer to the climate class and the study referenced in Table 1.
