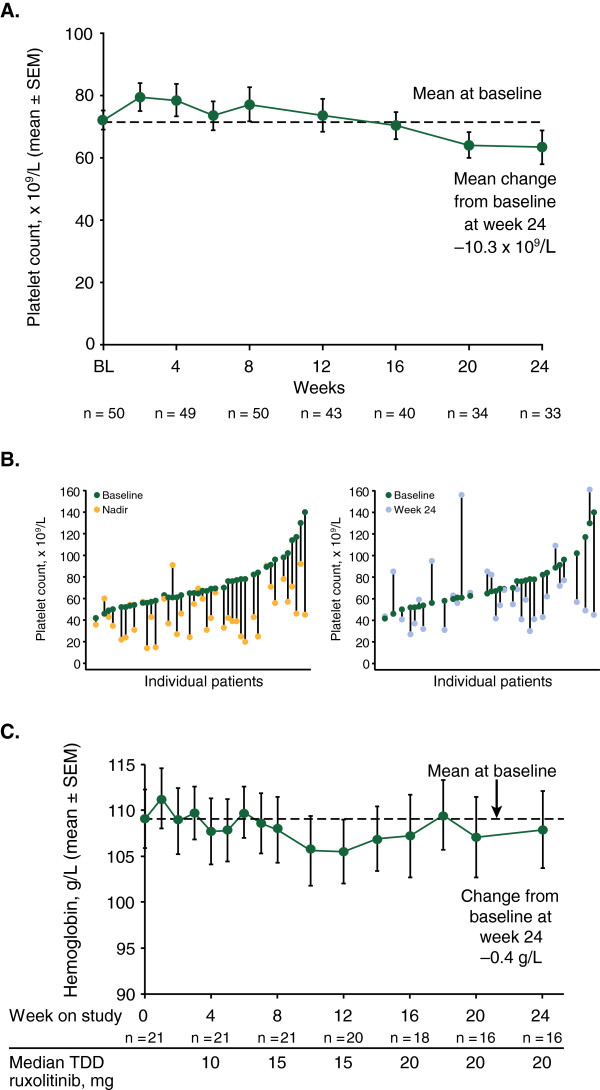
Figure 4.

Changes in hematologic parameters. (A) Mean (SEM) platelet counts over time. (B) Changes in individual platelet counts from baseline to nadir (left panel) and baseline to week 24 (right panel). (C) Mean (SEM) hemoglobin levels over time in patients who did not receive red blood cell transfusions during the study. SEM, standard error of mean; TDD, total daily dose.
