Figure 3.

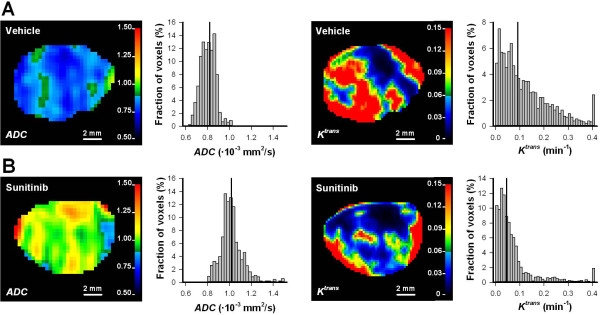
ADC and Ktrans images. ADC image, the corresponding ADC frequency distribution, Ktrans image, and the corresponding Ktrans frequency distribution of a representative untreated A-07 tumor (A) and a representative sunitinib-treated A-07 tumor (B). Color bars show ADC scale in 10-3 mm2/s or Ktrans scale in min-1. Vertical line in the frequency distributions shows median ADC or median Ktrans.
