
Figure 1.
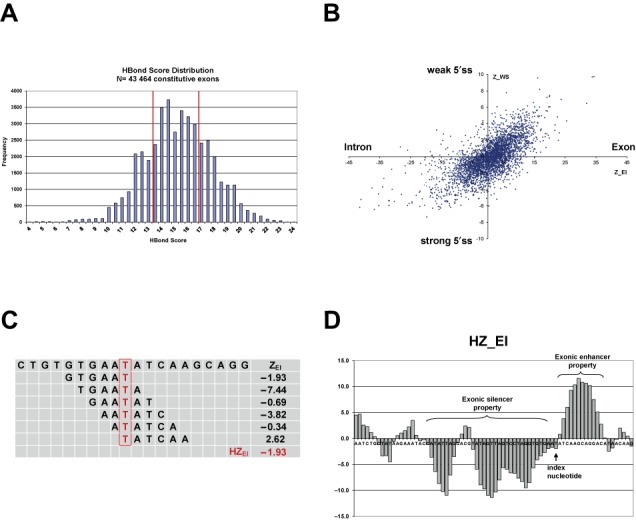
(A, B) HBond score distribution and relative hexamer abundance in human 5′ss neighborhoods. (A) HBond score distribution in 43 464 canonical 5′ss of constitutively spliced internal human exons. Vertical red lines denote lower and upper quartile boundaries at HBS = 13.5 and HBS = 17.0, respectively. (B) Scatterplot of hexamer overabundance Z-scores comparing exons with introns (ZEI) and exons of weak (10 359 5′ss with HBS ≤ 13.5) with strong (10 407 5′ss with HBS > 17.0) 5′ss (ZWS). Each dot represents one of the 4096 hexamers at coordinates (ZEI, ZWS). Hexamers e.g. in the top right hand corner were significantly over-represented in exons versus introns and in exons of weak versus strong 5′ss, and were potential RESCUE-ESE candidates. (C, D) HEXplorer score: sliding window average of ZEI-score. (C) Schematic of HEXplorer score calculation for an exemplary region from HIV-1 exon 3. For the index nucleotide T (denoted in red), the HEXplorer score HZEI was calculated as average ZEI score of all six overlapping hexamers. These six individual hexamers and their respective ZEI scores are given in the rows below. The last row contains the HEXplorer score as average of the six ZEI. (D) Exemplary HZEI plot of HIV-1 exon 3. The arrow indicates the position of the index nucleotide from (A). Prominent HZEI positive and negative regions with exonic splice enhancing or silencing properties are indicated by curly braces.