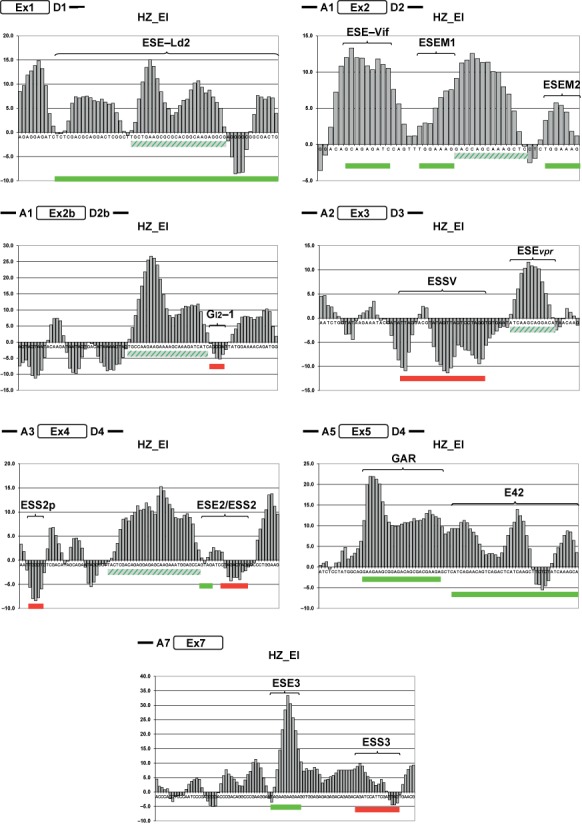
Figure 3.

HEXplorer score profiles of HIV-1 exons. HZEI-score plots of HIV-1 exonic sequences derived from the molecular clone NL4–3. Nucleotides are plotted along the horizontal axis and HEXplorer score values HZEI on the vertical axis. Location of the plotted subgenomic region is schematically shown as an open box on the left-hand side. Known exonic SREs are indicated by curly braces and green (enhancer) or red (silencer) rectangles. Five HEXplorer-predicted enhancers are indicated by dashed green rectangles.
