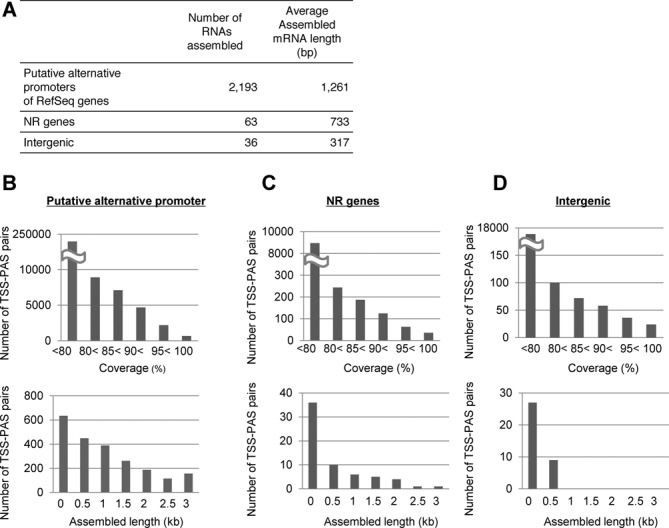
Figure 10.

Mapped assembly of the transcripts of putative alternative promoter products and intervening lncRNAs. (A) Statistics of RNA assembly using TSS-PAS/Random tags. (B) Distributions of the numbers of successfully assembled transcripts at the indicated coverage for putative alternative promoter products (upper panel) and length distribution of the assembled transcripts (lower panel). (C, D) Results of the same analysis as in (B) for the NR genes and for the putative intervening lncRNAs.
