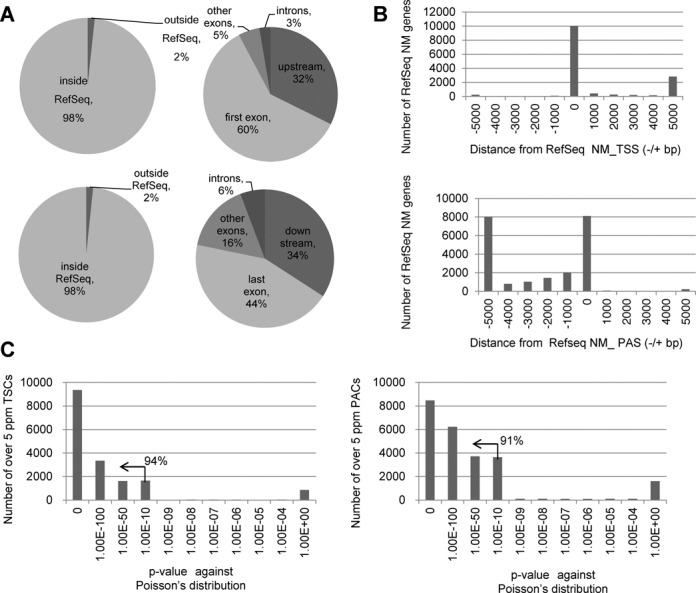
Figure 2.

Evaluation of the TSS/PAS libraries. (A) Positions of the TSS/PAS mate pair tags relative to RefSeq genes. The frequencies of the TSS/PAS tags were calculated depending on their location within or outside RefSeq gene regions (left panels). Among the tags associated with RefSeq genes, their distributions were further separated depending on the internal positions of the RefSeq transcript models (right panels). The top panels show the TSS tags and the bottom panels show the PAS tags. The right panels represent the breakdowns of the population ‘inside RefSeq’ in the left panels. (B) The distribution of the locations of TSS tags and PAS tags relative to the RefSeq NM transcript model. The top panel shows the TSS tags and the bottom panel shows the PAS tags (see Supplementary Figure S2J for further breakdowns of the longer populations). Additionally, note that in many cases, the RefSeq model included a long transcript with a distal 5′-exon. At the same time, RefSeq annotates another 5′-exon, which overlaps with our TSC, downstream from that distal 5′-exon (right margin; Supplementary Figure S2J). For further details on the overlap between the TSCs or our data and the RefSeq data, see Supplementary Figure S2A–C. (C) Statistical significance of the biased distribution of the TSS tags and PAS tags to the TSC or PAC (left and right panels, respectively) calculated against the random distribution on the mRNA assuming a Poisson distribution. The numbers of TSCs or PACs giving the indicated P values (x-axis) are shown. The percentages in the plots show the proportions of the indicated populations (P < 1e−10).
