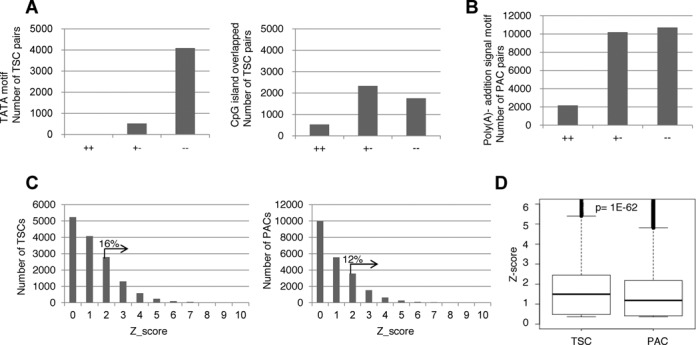
Figure 4.

Characterization of multiple TSCs and PACs. (A) The presence of potential cis-regulatory motifs between multiple TSCs and PACs. The number of alternative TSCs for which TATA boxes (left panel) or CpG islands (right panel) were detected for both (+ +), either (+ −) or neither (− −) of the TSCs. (B) Results of a similar analysis as in (A) for the alternative PACs and the presence of the canonical poly(A)-addition sequence. For the definitions of each cis-motif, see the Materials and Methods section. (C) Tissue specificities of the detected TSCs (left panel) and PACs (right panel). The Z-scores in the plots were calculated for each TSC or PAC according to the procedure described in the Materials and Methods section. The percentages represent the proportions belonging to the indicated populations. (D) Boxplots showing the distributions of the Z-scores for the TSCs and PACs. The statistical significance of the difference, as evaluated by Wilcoxon's signed rank test, is shown at the top.
