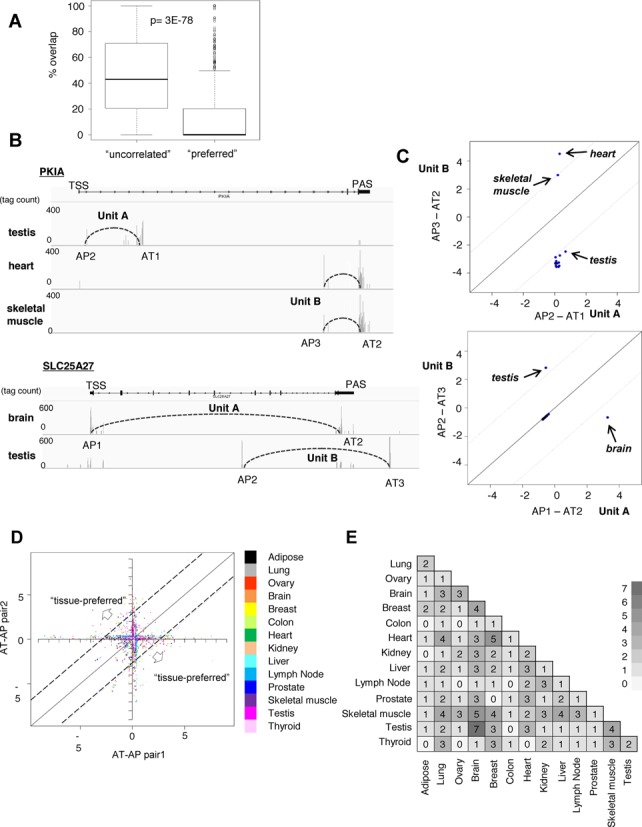
Figure 5.

Characterization of mutually preferred TSC-PAC pairs. (A) Overlap of the protein-coding regions of two pairs of TSC-PACs within a single gene. A boxplot chart of the proportion of the genic regions that overlapped between pairs of TSC-PACs is shown. The left entry represents the total population and the right entry represents the ‘preferred’ TSC-PACs. The statistical significance of the difference was evaluated by Wilcoxon's signed rank test. (B) Examples of multiple TSCs and PACs for which mutual selections were preferred over other pairs. The cases of the PKIA and SLC25A27 genes are shown. Expression profiles of the indicated TSC–PAC relationships are also shown in the indicated tissues. Vertical lines indicate the respective tag counts. (C) Expression patterns of the ‘preferred’ TSC–PAC relationships. For each ‘preferred’ TSC-PAC pair (Units A and B), a Z-score of the expression pattern was calculated for each unit (Unit A on the x-axis and Unit B on the y-axis) in the indicated tissues. (D) Overlay of a plot similar to the one in (C) with the plot of the total ‘preferred’ TSC-PACs. Color code for the tissues is indicated in the inset. (E) The number of ‘preferred’ TSC–PAC relationships for which the expression patterns were switched between the indicated tissues with Z-scores of >2.
