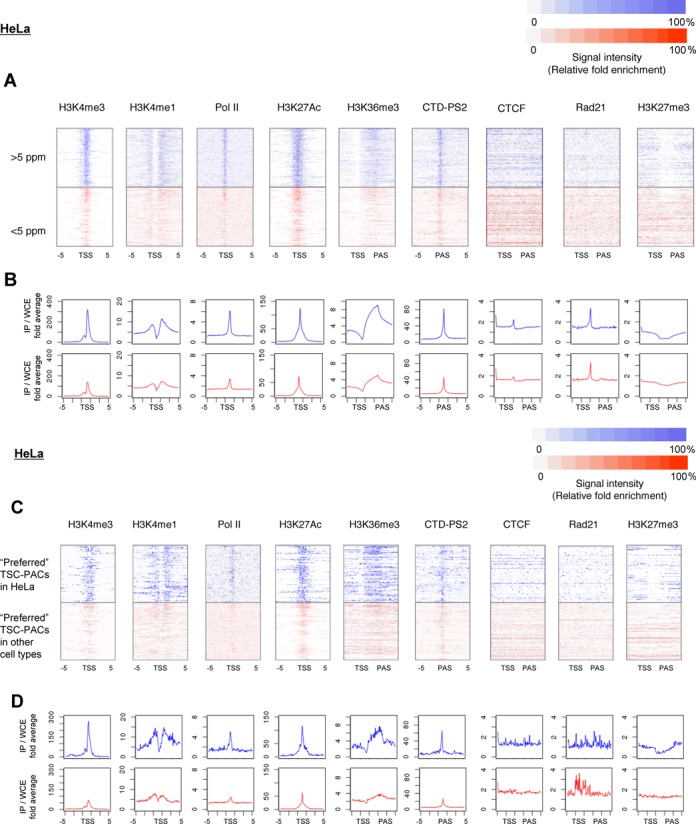
Figure 6.

Relationships between transcript structure and chromatin signature. (A) Densities of ChIP Seq signals in HeLa cells for the indicated chromatin signatures. Color code of the ChIP Seq tag density is shown in the margin. Cases where the transcript levels are >5 ppm (upper) and <5 ppm (lower) are shown in blue and red, respectively. For Pol II, H3K4me1, H3K4me3 and H3K27Ac, peaks within 5 kb from the 5′-end of the RefSeq genes were used for the centralization. For H3K36me3, H3K27me3, Rad21 and CTCF, the transcript region defined as the region between TSC and PAC was normalized, and the ChIP Seq signals were plotted accordingly. For CTD-PS2, the peaks located within the range of −5 kb to 5 kb from the PACs were selected and centralized to the center of the peaks. (B) Average values of the ChIP Seq signal intensities at the indicated positions (x-axis). (C, D) Results of similar analysis to (A) and (B) for the preferred TSC-PAC regions.
