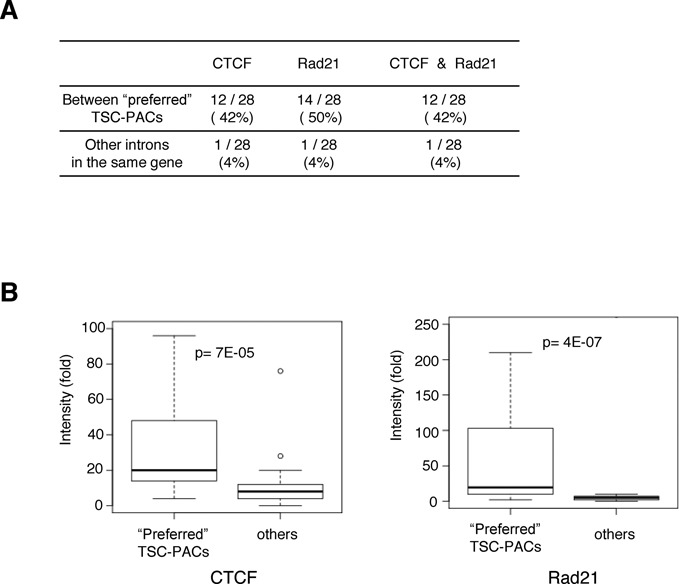
Figure 7.

(A) Chromatin signatures between preferred TSC-PAC pairs. Frequencies of the ChIP Seq peaks for Rad21 and CTCF identified in the indicated regions. (B) Densities of the ChIP Seq signals for the indicated populations. The statistical significances of the differences, as evaluated by Wilcoxon's signed rank test, are shown at the top.
