Figure 5.

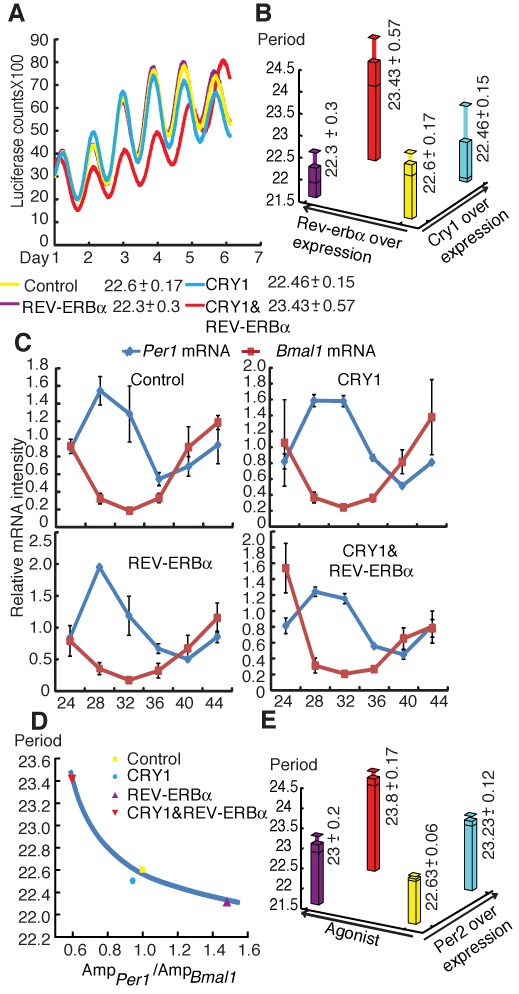
Manipulating the circadian period through the disruption of the transmitting effect. (A) Bioluminescence results from a representative experiment 36 h after cells were cotransfected with the indicated expression vectors. All experiments were repeated at least three times, and at least three replicates were performed for each group. (B) The relationship between period length (z-axis), and REV-ERBα overexpression (x-axis) and CRY1 overexpression (y-axis). The yellow bar indicates the period of the control group with blank vectors (22.6 h). Upon CRY1 or REV-ERBα overexpression, the period remains at 22.46 h (the cyan bar) or 22.3 h (the purple bar). Upon the overexpression of both CRY1 and REV-ERBα, the period increases to 23.46 h (the red bar). (C) Expression profiles of the Bmal1 (red) and Per1 (blue) clock genes in U2OS cells with the indicated vectors were measured by qPCR and normalized to Gapdh. The expression levels were plotted as percentages of the control amplitude in each paired experiment. Each value represents the mean ± SD (n = 3). (D) The periods of cells transfected with the indicated vectors are shown versus the amplitude ratio of Per1 mRNA to Bmal1 mRNA. Each period represents the mean of three experiments. (E) The relationship between period length (z-axis), and PPARα agonist overexpression (x-axis) and PER2 overexpression (y-axis). The period of the control group is 22.63 h, which is indicated by the yellow bar. Upon PER2 overexpression or agonist added only, the period remains at 23 h (cyan bar) or 23.23 h (the purple bar). Upon the overexpression of both PER2 and agonist, the period increases to 23.8 h (the red bar).
