
Figure 7.
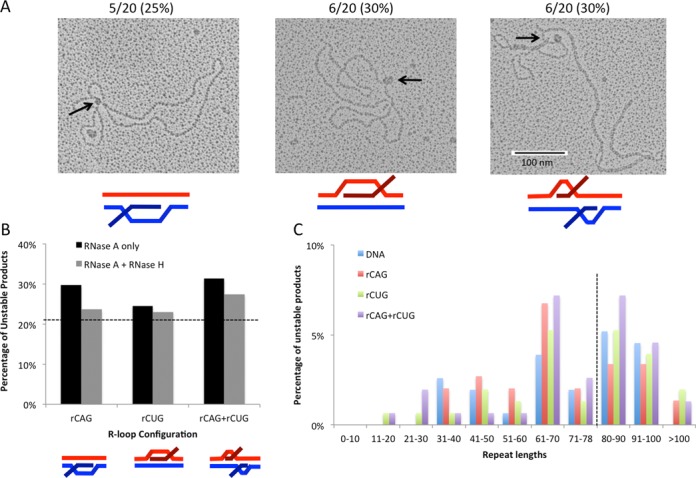
Instability analysis following R-loop removal. (A) Detection of S-DNA structures following R-loop removal with RNase H. DNA templates were transcribed to generate r(CAG), r(CUG) or r(CAG)+r(CUG) R-loops and then treated with RNase A and RNase H to remove all single-stranded RNA and RNA:DNA hybrids. EM was performed on individual molecules in the presence of bacterial SSB to detect unpaired DNA strands that exist in S-DNA structures (see ‘Materials and Methods’). A total of 20 molecules were analyzed for each sample type. DNA controls that were not transcribed contained 2/20 (10%) molecules bound by SSB. The number of samples bound by SSB at a single position following R-loop removal is indicated above each image and expressed as a percentage. (B) Percentage of unstable products following processing of RNase H-treated R-loops. R-loop products of each configuration were treated with RNase H prior to cell extract processing and assessed for instability through STRIP analysis as in (A). Products from (A) (RNase A only) were compared to RNase H-treated R-loops (RNase A+H) using the χ2 test. Data for RNase H-treated R-loop processing are derived from three independent in vitro transcription and human cell extract processing reactions with ∼150 colonies representing 150 individual products of cell extract treatment for each RNase H-treated R-loop configuration. Specific colony numbers are as follows: rCAG-148, rCUG-152, rCAG+rCUG-153. Dashed line indicates DNA control level of instability (21%) for comparison. (C) Distribution of unstable products of HeLa extract processing following RNase-H-mediated R-loop removal. Sizes were determined for each unstable product of processing from electrophoretic migration position relative to known size markers as previously described (26) and plotted. Only unstable products are shown; the stable repeat size of 79 is indicated by the dashed vertical line.