Figure 1.

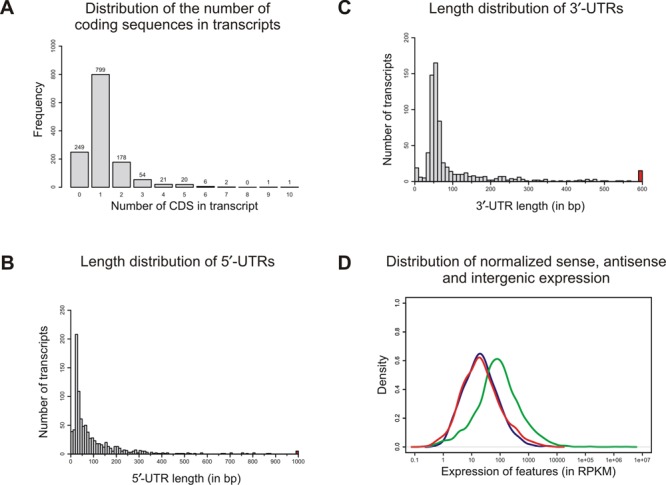
Transcriptome annotation and expression. (A) Frequency for transcripts containing different numbers of genes. (B) 5′-UTR length distribution of 918 annotated protein coding genes on the ring chromosome for which a distinct primary TSS could be assigned. 5′-UTRs longer than 1000 nt were collapsed into one colored bin. (C) 3′-UTR length distribution of 709 annotated protein coding genes for which a distinct TES could be assigned. 3′-UTRs longer than 600 nucleotides were collapsed into one colored bin. (D) Expression values in RPKM for genes (green), antisense transcription (red) and intergenic regions (blue).
