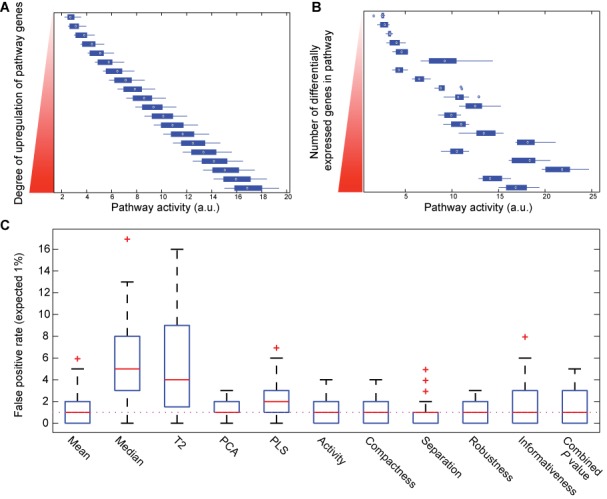
Figure 2.

Sensitivity analysis using simulated datasets and models. (A) Pathway activity measure changes linearly with uniform change in expression of all annotated genes. (B) Pathway activity measure is linearly sensitive to change in number of significantly differentially expressed genes in a pathway. (C) Median value of false positive rates for all MIPA measures matches the expected rate of 1% (dotted line). Performance of MIPA measures is comparable with that of Mean and PCA methods. P-values from all 5 MIPA measures were combined using Stouffer's Z-score method.
