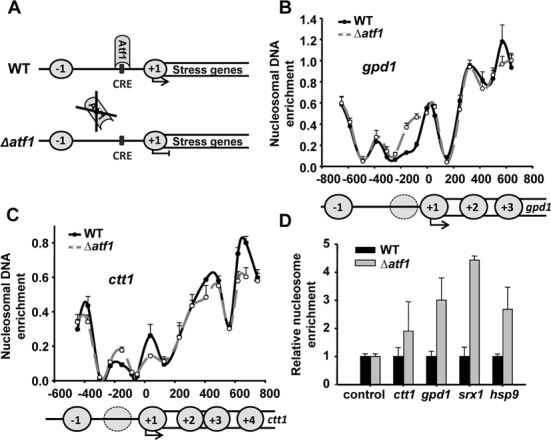
Figure 1.

Atf1promotes NDR formation at stress genes. (A) Schematic representation of the Atf1 DNA-binding at the CRE site of stress promoters in wild-type and Δatf1 strains. (B and C) Mononucleosomes were isolated from cultures of strains 972 (WT) and MS98 (Δatf1). qPCR was performed using 17 pairs of primers covering 1.3 and 1.2 kb of the promoters, TSS (black arrow) and coding regions (white rectangle) of gpd1 (B) or ctt1 (C), respectively. The values of nucleosome occupancy for each qPCR reaction (Y-axis) is plotted against the gene position of the centre of the PCR-amplified fragment for each primers pair, relative to the TSS, with a value of 0 (X-axis). Nucleosomes are represented as circles. (D) Relative nucleosome occupancy was determined as described above using primers for mei2 (control), ctt1, gpd1, srx1 and hsp9 promoters. The graph shows the nucleosome occupancy at Δatf1 cells relative to wild-type strain, with an assigned value of 1 in each gene. Error bars (SEM) were calculated from biological triplicates.
