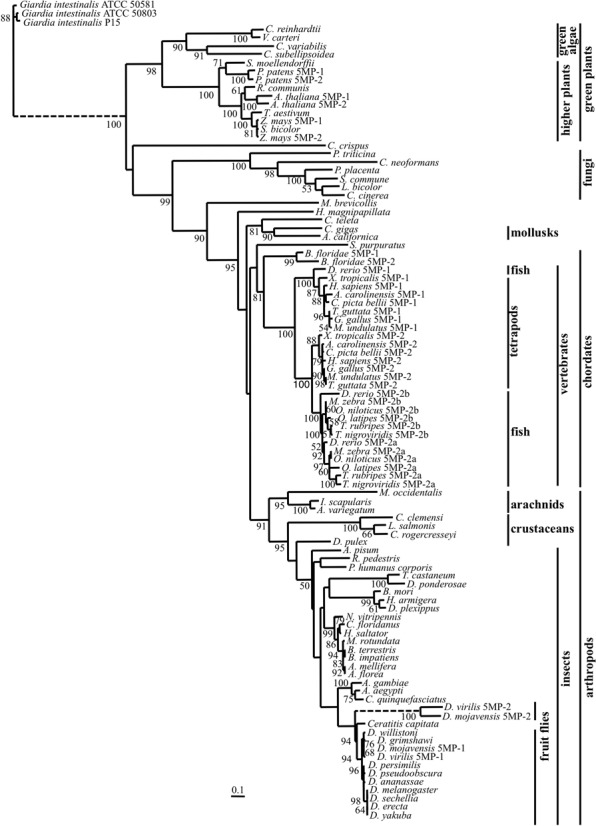
Figure 1.

Phylogeny of 5MP homologs. Maximum-likelihood phylogenetic analysis showing the relatedness among 5MP homologs (see Supplementary text for their list). Bootstrap values above 50% are indicated on the branches. This phylogenetic tree was rooted using 5MP from the three G. intestinalis strains as outgroup. The dashed lines represent branches that were shortened by a factor of three for presentation purposes.
