
Figure 2.
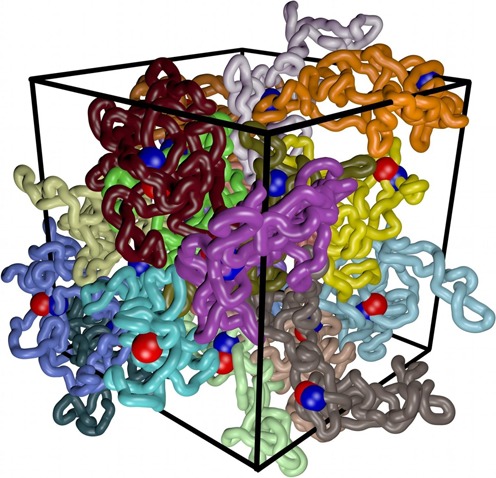
Simulation snapshot revealing highly crowded state of modelled chromatin loops. The density of modelled chromatin loops was set to 20% of volume occupation. In the shown snapshot individual supercoiled loops are each given a different colour, whereas beads corresponding to enhancers and promoters are shown as blue and red. The snapshot shows the state of the system after it has reached the equilibrium and it corresponds to the highest supercoiling (ΔLk = −20) and highest enhancer–promoter affinities (ε = 12 kBT) investigated by us (see Figure 3). Notice that in this simulation enhancers were showing affinity only to promoters located in the same topological domain, which is different to the situation shown in Figure 4.