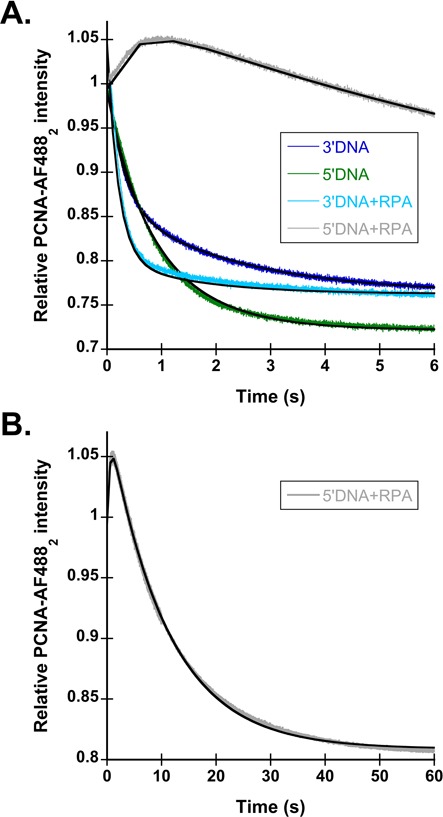
Figure 3.

RPA inhibits PCNA loading on the incorrect polarity of DNA. (A) Representative time courses for PCNA-AF4882 closing are shown using the DNA structures shown in Figure 1C. The 3′DNA is shown in dark blue, 5′DNA is shown in green, 3′DNA·RPA is shown in light blue and 5′DNA·RPA is shown in gray. PCNA-AF4882 closing was performed as described in Figure 1B, with final concentrations of components: 20 nM RFC, 20 nM PCNA-AF4882, 40 nM DNA, 0.5 mM ATP and 200 nM unlabeled PCNA. The time courses were fit to double exponential decays (Eq. 2), except for 5′DNA·RPA, which was fit to an exponential increase and decrease (Eq. 3). The black lines through the time courses represent the results of this fit, and observed rates calculated from this fit are reported in Table 2. (B) PCNA-AF4882 closing with 5′DNA·RPA, on a longer time scale.
