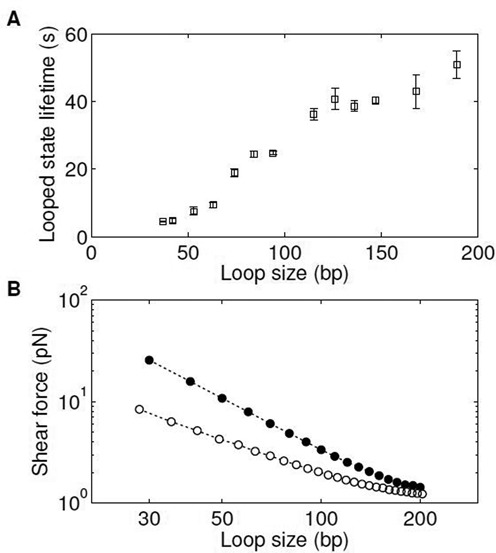
Figure 2.

Shear-force-dependent loop breakage. (A) Looped state lifetime versus loop size. The loop lifetime at various sizes was measured in 50 mM NaCl. The error bar is the SEM from at least four measurements. (B) Line-scatter log–log plot of calculated shear force versus loop size. The shear force is calculated from the biased MC simulation using the WLC model with a persistence length of 50 nm (filled circles) or the LSEC model (open circles). For each loop size, we performed three simulations, each with ∼5 × 10⁶ accepted conformations. The error bar size is typically smaller than the size of the symbol. See Materials and Methods for more information on the simulation details.
