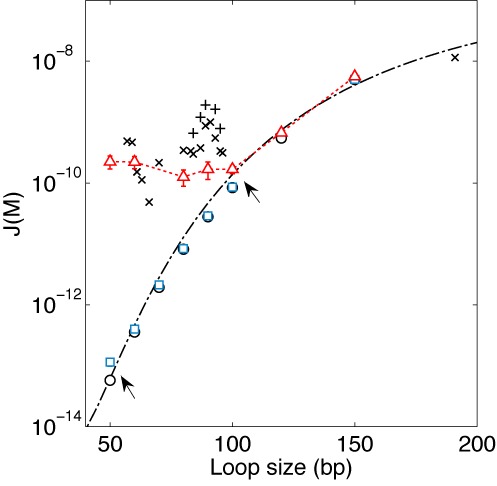
Figure 5.

J factor comparison. The J factor was computed using a fixed end-to-end distance of 5 nm without end-to-end angular or torsional constraints. We used the WHAM to calculate J factors predicted by the WLC model (black circles), the KWLC model with  and
and  (red triangles), and with
  and
and  (blue squares). The dash-dotted line is the WLC prediction according to the Douarche–Cocco approximation (47). For comparison, the J factors from Vafabakhsh and Ha (24) are also shown. Symbols marked with ‘x’ indicate J factors measured from surface-immobilized DNA in 1 M [Na+] and symbols marked with ‘+’ from vesicle-encapsulated DNA at 10 mM [Mg2+]. For consistency with our calculation, we shifted the original data (24) by 10 bp to the left to account for the linker length. The arrows indicate where the KWLC model deviates from the WLC model. We performed four simulations to generate the SEM error bars for each J factor.
