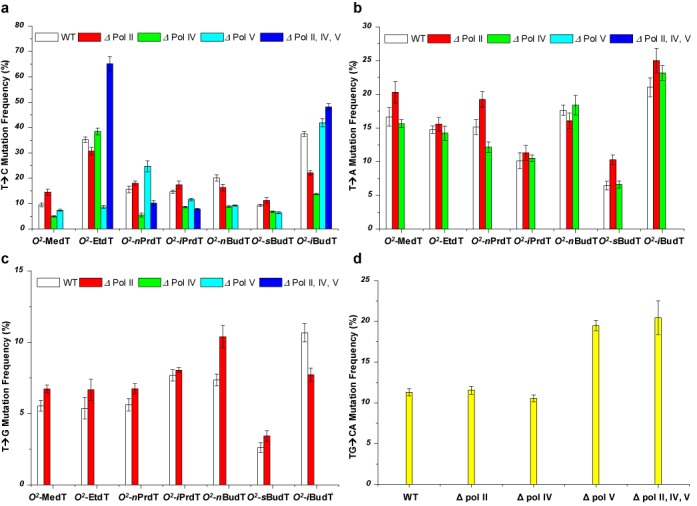
Figure 4.

Mutation frequencies of the O2-alkyldT lesions in E. coli cells. Shown are the frequencies for the T→C (a), T→A (b) and T→G (c) mutations observed for the O2-alkyldT lesions, and the TG→CA mutation found for O2-iPrdT (d). The data represent the means and standard deviations of results from three independent replication experiments.
