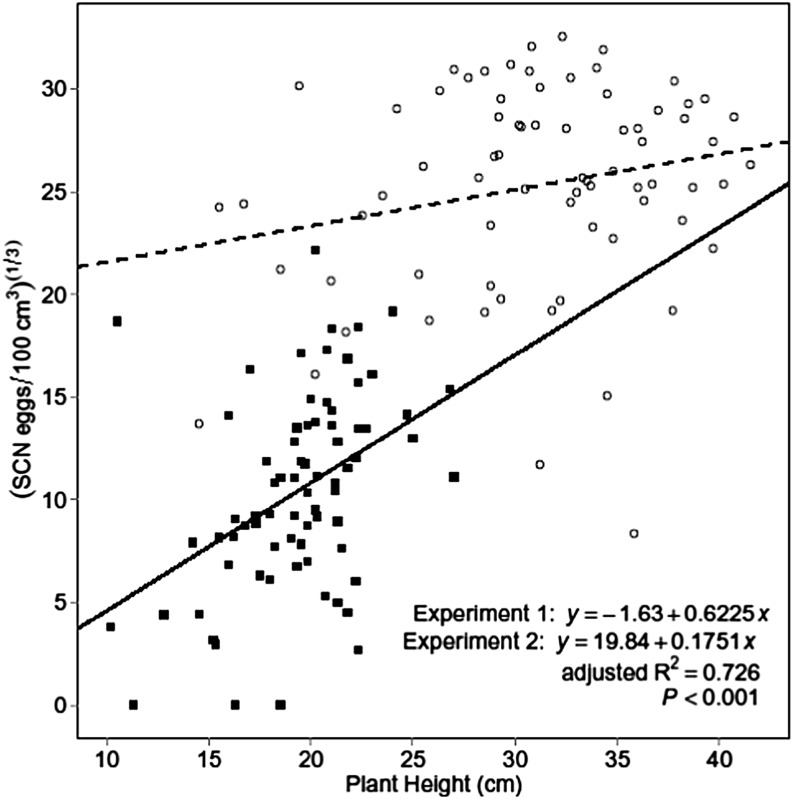
Fig. 4.
Linear regression of soybean cyst nematode (SCN) egg population density on mean plant height (both at 40 d after planting) with separate intercepts for each experiment. Solid and dashed lines are equations for Experiments 1 and 2, respectively. Solid square and hollow circle points represent pots from Experiments 1 and 2, respectively.

