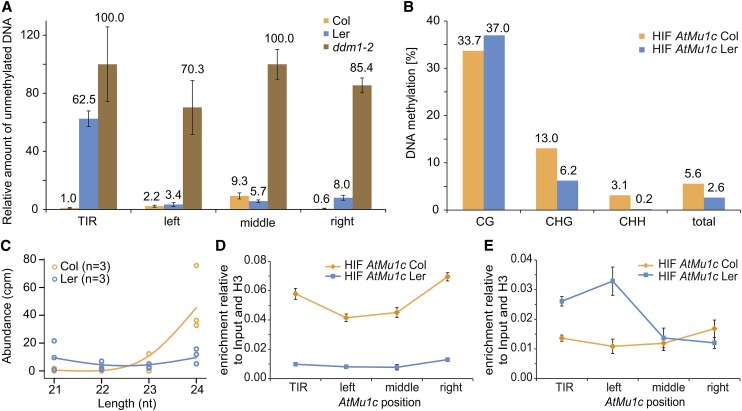
Figure 4.
AtMu1c from Col, but Not Ler, Displays Hallmarks of Epigenetic Silencing.
(A) DNA methylation analysis of AtMu1c from Col and Ler by McrBC qPCR. Amplification values were normalized to mock-treated DNA. Four different regions of AtMu1c were investigated (cf. Figure 3D). Error bars are se of three replicates.
(B) DNA methylation analysis by bisulfite sequencing of AtMu1c TIR in an HIF segregating for eQTL-Mu1 and AtMu1c(Col). Percentages of DNA methylation were calculated from 23 independent clones each (cf. Supplemental Table 2).
(C) Abundance of 21- to 24-nucleotide sRNAs (Li et al., 2012) perfectly matching AtMu1c (including TIRs) from Ler and Col. Dots represent individual data points of three replicates.
(D) and (E) Histone H3K9 dimethylation (D) and H3K4 trimethylation (E) levels at AtMu1c(Col) and AtMu1c(Ler) in the HIF lines determined by chromatin immunoprecipitation. Data normalized to input and H3 occupancy were averaged over three biological replicates. Error bars represent se.

