Figure 5.
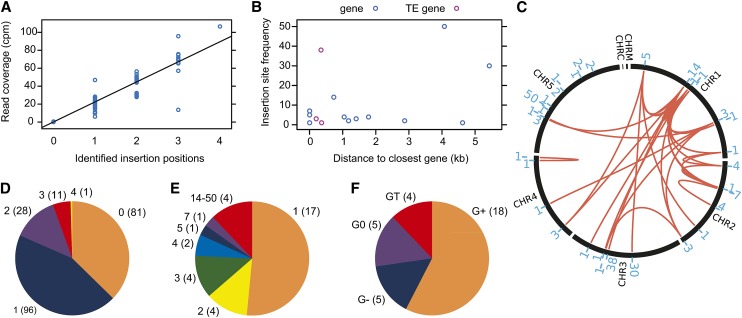
Evidence for AtMu1c Transposition in the Arabidopsis Lineage and Characterization of Novel Insertion Sites from the Analysis of 217 Accessions.
(A) Correlation of Illumina read coverage and number of identified AtMu1c insertions.
(B) Insertion site frequency (number of accessions where this insertion was present) depending on the distance to the neighboring gene/TE gene.
(C) Number and distribution of AtMu1c insertion sites across chromosomes. The red lines connect insertions that occurred together in individual accessions. The blue numbers indicate the number of accessions where this particular insertion was found. For details, see Supplemental Data Set 1.
(D) Distribution of AtMu1c copy numbers in the accessions analyzed; numbers in parentheses are number of accessions.
(E) Classification of insertion sites according to their frequency; numbers in parentheses are number of insertions.
(F) Classification of insertion sites according to their distance from the next neighboring gene/TE; numbers in parentheses are number of insertions. G0, insertion site within an annotated protein-coding gene; G+, insertion site outside but within 2.0 kb of a protein-coding gene; G−, insertion site more than 2.0 kb away from a protein-coding gene; GT, insertion site within or next to a TE gene.

