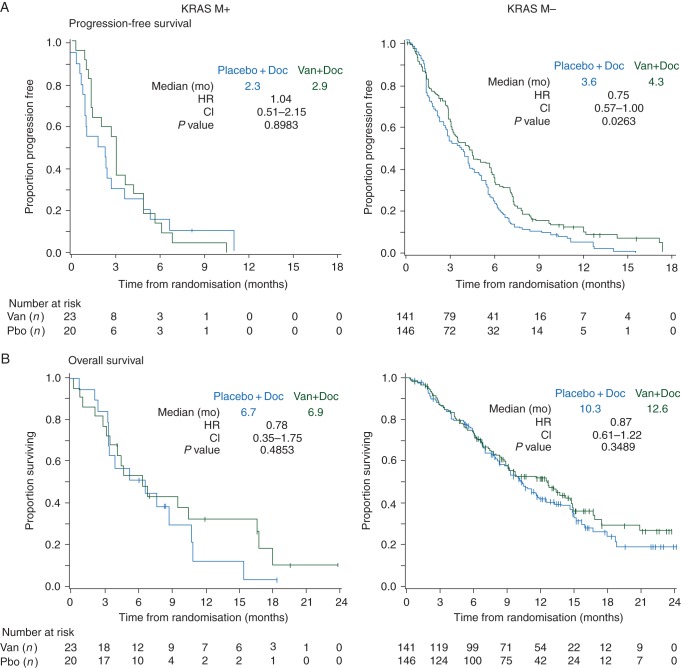
Figure 4.
Kaplan–Meier curves for (A) progression-free survival, and (B) overall survival by KRAS gene mutation (KRAS MT) status. Van (vandetanib), Doc (docetaxel), Pbo (placebo), mo (months), HR (hazard ratio), CI (confidence interval). HR <1.0 favors vandetanib + docetaxel versus placebo + docetaxel.

