Figure 3.

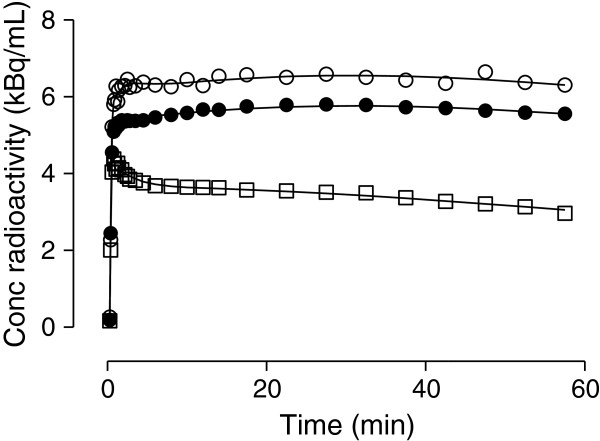
Representative brain time-activity curves in one subject. Three regions are shown: putamen (empty circle), parietal cortex (filled circle), and cerebellum (empty square). Lines represent fitting with unconstrained 2TCM.

Representative brain time-activity curves in one subject. Three regions are shown: putamen (empty circle), parietal cortex (filled circle), and cerebellum (empty square). Lines represent fitting with unconstrained 2TCM.