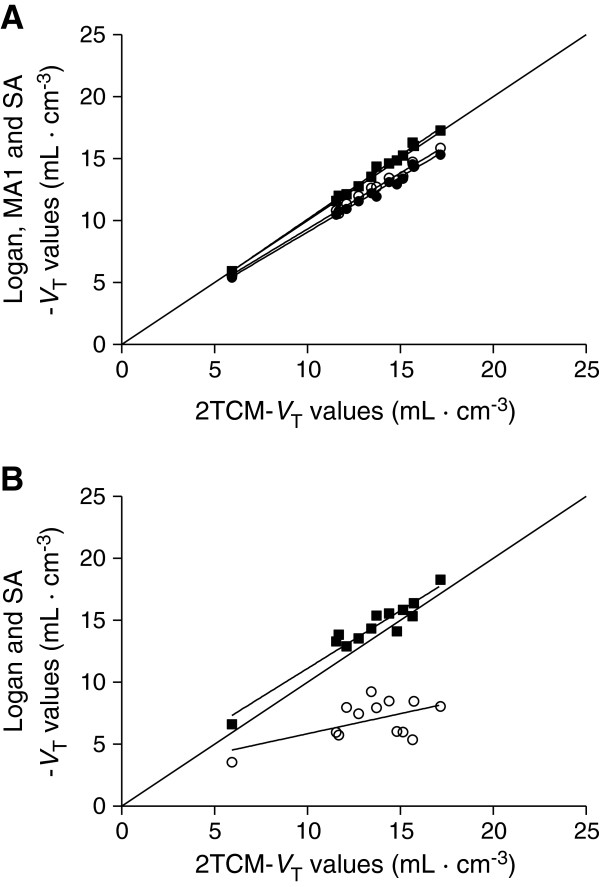
Figure 5.

Regression analyses for VT results obtained from the 13 brain regions of a 23-year-old subject. (A) Spectral analysis (filled square) provided good results with a very small bias (+1.4%). Logan (empty circle) and MA1 (filled circle) slightly underestimated VT values (-7.4% and -9.7%, respectively, for this subject). At the voxel level (B), only SA provided results with a small bias and good correlation with 2TCM (0.932x + 1.793, R2 = 0.92, p < 0.0001). In contrast, Loganvoxel underestimated VT values by about 47% (0.324x + 2.61, R2 = 0.32, p = 0.047).
