
Figure 3.
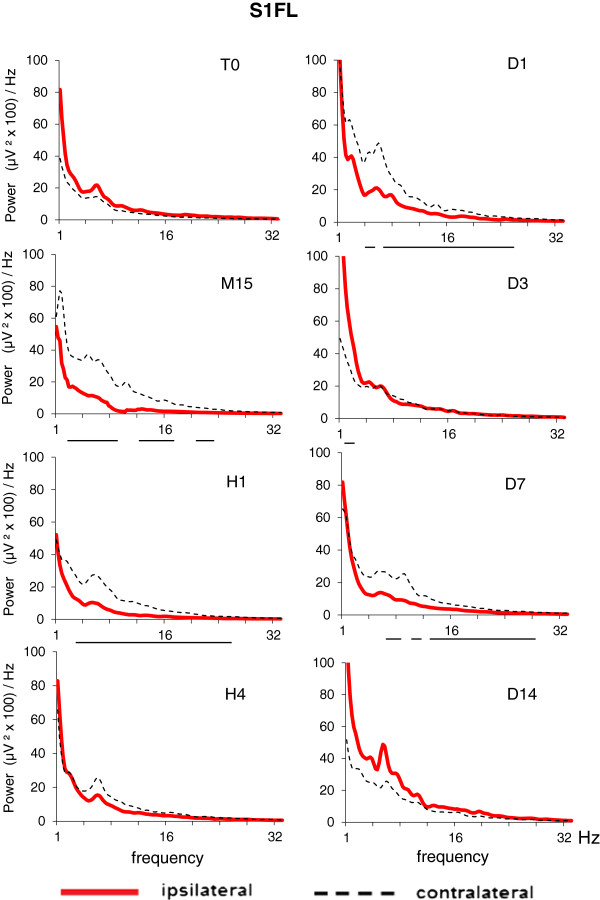
EEG spectral density profiles in ipsilateral (left) and contralateral (right) homologous points of somatosensory cortex, forelimb region (S1FL) before (T0) and after Et-1-induced stroke in conscious middle-aged rats (Mi, n = 14). The time sessions are as in Figure 1. The horizontal lines below pairs of ipsi/contralateral spectral profiles for each time session denote statistical difference at each frequency bin (0.25 Hz) from 0 to 32 Hz (Wilcoxon matched pairs test with P < 0.05).