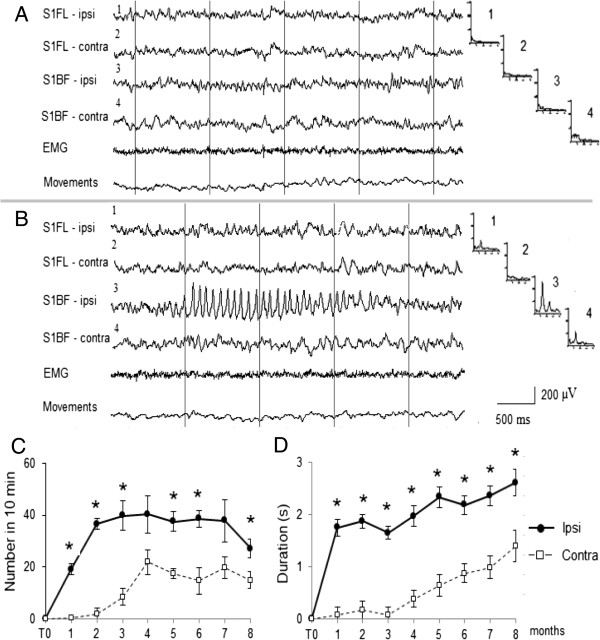
Figure 7.

Example of EEG evolution derived from a rat studied longitudinally from month one (the rat is 4-month-old) to month eight (the rats is 12-month old) after Et-1. A: background EEG raw record before Et-1. B: 5 months after Et-1. The EEG records are shown in homologous (ipsi- and contralateral) areas of S1FL and S1BF. High-voltage spindles (HVS) are seen in the ipsilateral S1BF. The recording of electromiography (EMG) and rat’s movements show that the rat is immobile during the HVS. Corresponding mean spectral FFT profiles (n = 20 EEG epochs) are shown on the right of each EEG channel. On the abscissa: frequency from 1 to 32 Hz, on the ordinate: EEG spectral power, μV2/Hz. Note the large peak at 9.5 Hz in the spectral FFT profile (B3) corresponding to the frequency of the HVS waves in the ipsilateral S1BF and absence of such a pick in the contralateral S1BF spectral profile (B4). Number and duration of the HVSs (in 10-min epochs of waking immobility) in the ipsilateral and contralateral S1BF are shown in C (number) and D (duration) during 8-months follow-up. T0 – before Et-1. Data values are means ± S.E.M. for 10 min EEG epochs. * P <0.05 (Wilcoxon nonparametric test).
