
Figure 1. Blood Pressure.
Systolic blood pressure (A, SBP), diastolic blood pressure (B, DBP) and total peripheral resistance (C, TPR) in dams that lactated and did not lactate. Data are expressed as dot plot with a line at the mean and whiskers showing standard deviation.
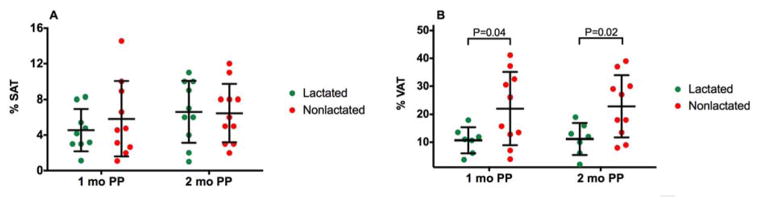
PP, postpartum