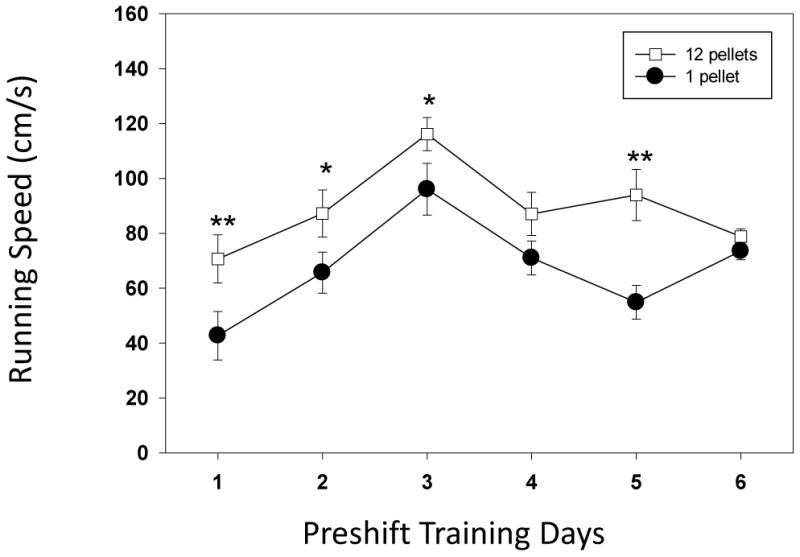
Figure 4.

Running speeds (cm/s) for the two groups of animals in the preshift training period (6 days) during exposure to the cues that predict the specific outcome. The days represent the 6 day period during which the animals are exposed to either high reward (12 pellet) or low reward (1 pellet). A significant difference between groups was seen on each except for days 1, 2, 3 and 5 (Mann-Whitney U test for between group analysis; *= p<0.05; **= p<0.01 and *** = p<0.001; bars denote standard error of the mean.
