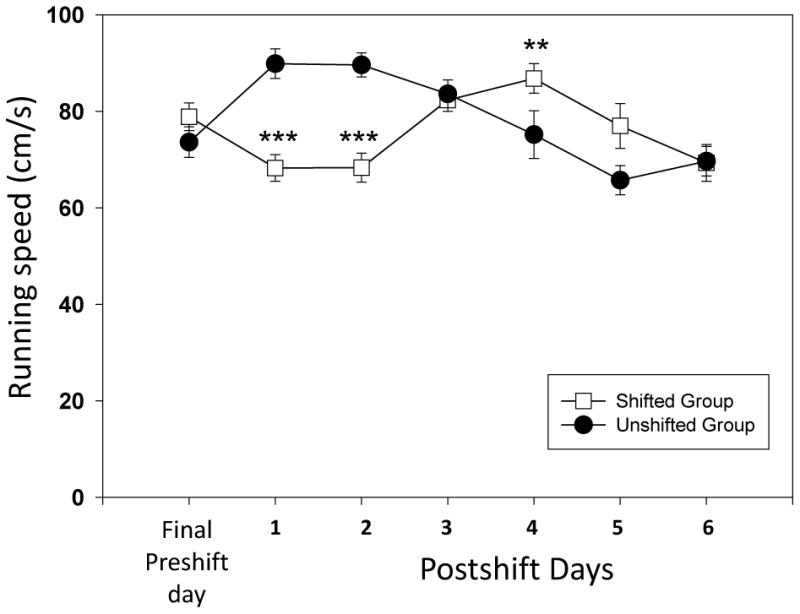
Figure 5.

Running speed (cm/s) for the two groups of animals (shifted versus unshifted) during the cued version of the runway task. Cues were placed at the end of the runway as visual predictors for reward magnitude. The days represented are the final preshift day as well as six postshift test days. (Mann-Whitney U test for between group analysis; *= p<0.05; **= p<0.01 and *** = p<0.001; bars denote standard error of the mean).
