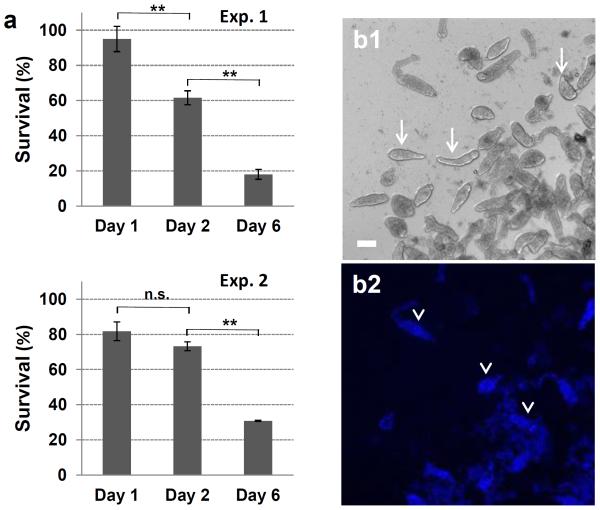
Fig. 7.
Viability of cercariae exposed to normal human serum for 18 h as determined by Hoechst dye staining. The percentage of parasite survival was determined on days 1, 2 and 6 after complement exposure; background mortality of parasites exposed to inactivated serum was subtracted from corresponding time points. Two independent experiments are shown (a). Representative images of parasites at day 6 in culture after complement exposure, showing live (b1, arrows) and dead fluorescent (b2, arrowheads) parasites. One-way ANOVA was used to calculate the differences between days 1, 2 and 6. **P ≤ 0. 01; n.s., not significant. Scale bars are 50 μm in a 10× magnification field

