
Figure 1.
mRNA Sequencing Analysis of Sorted X1 Neoblasts from Regenerating Planarians
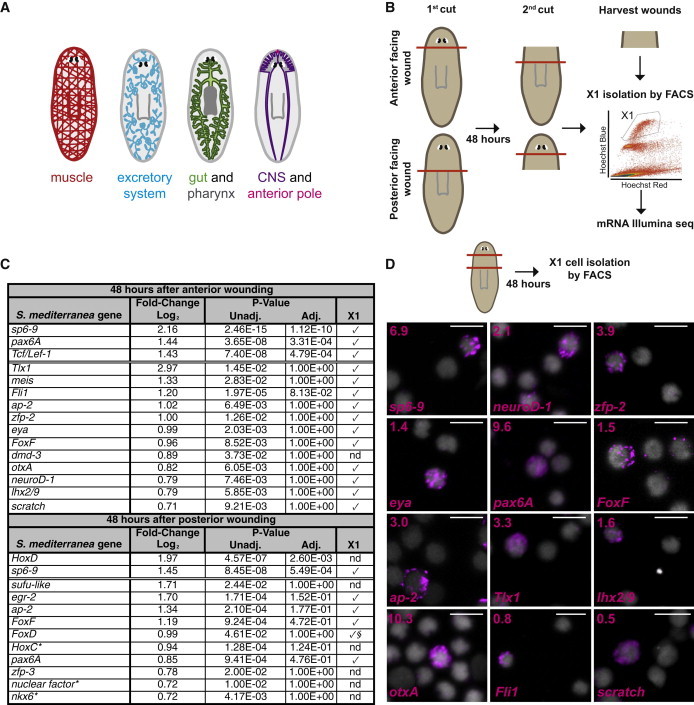
(A) Cartoon shows the planarian gastrovascular system with pharynx, the nervous system with photoreceptors, the excretory system, muscle, and the anterior pole.
(B) Schematic of the experimental approach. Prepharyngeal tissues were harvested 48 hr after amputation. Cell suspensions were labeled with Hoechst 33342 and X1 cells isolated by FACS. RNA was then purified from sorted X1 cells and mRNA Illumina sequencing performed.
(C) The table lists all the transcription factors that showed upregulated expression in X1 cells from wounded animals with Padj ≤ 0.05 (above double line) and Punadj ≤ 0.05 with a log2 fold change ≥ 0.7 (below double line). Check marks indicate expression was validated in sorted X1 cells from wounded planarians; nd, not determined. §From published work (Scimone et al., 2014); ∗best BLASTx hit to human transcripts.
(D) Schematic: X1 cells were isolated from prepharyngeal regions by FACS 48 hr after amputations, and cell FISH was performed using RNA probes from genes found in (C). DAPI labeled DNA (gray). Percentages of X1 cells expressing each transcription factor are shown in the upper left corners. Total number of X1 cells counted: sp6-9+ 14/202; neuroD-1+ 22/1034; zfp-2+ 7/180; eya+ 9/635; pax6A+ 107/1113; FoxF+ 3/205; ap-2+ 34/1137; Tlx1+ 5/152; lhx2/9+ 20/1222; otxA+ 16/155; Fli1+ 11/1463; scratch+ 4/766. Images shown are maximal-intensity projections. Scale bars, 10 μm.